Solar companies can reduce downtime and improve system performance by monitoring these five metrics in real time. Instead of waiting for monthly reports, live data analytics allows for immediate action when issues arise, saving time and increasing revenue. Here’s what to focus on:
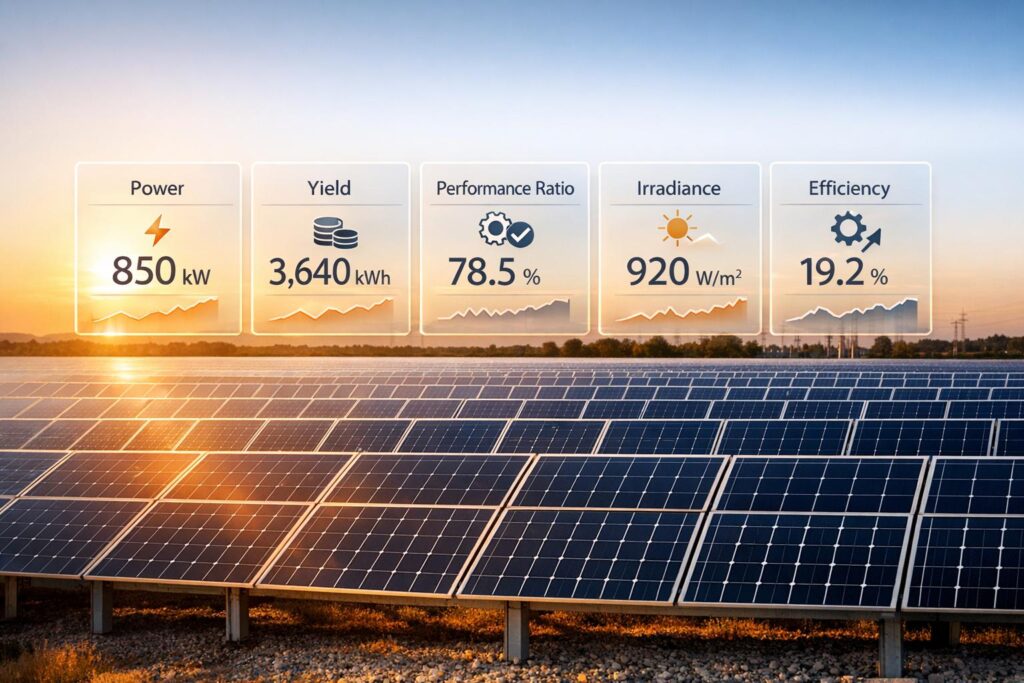
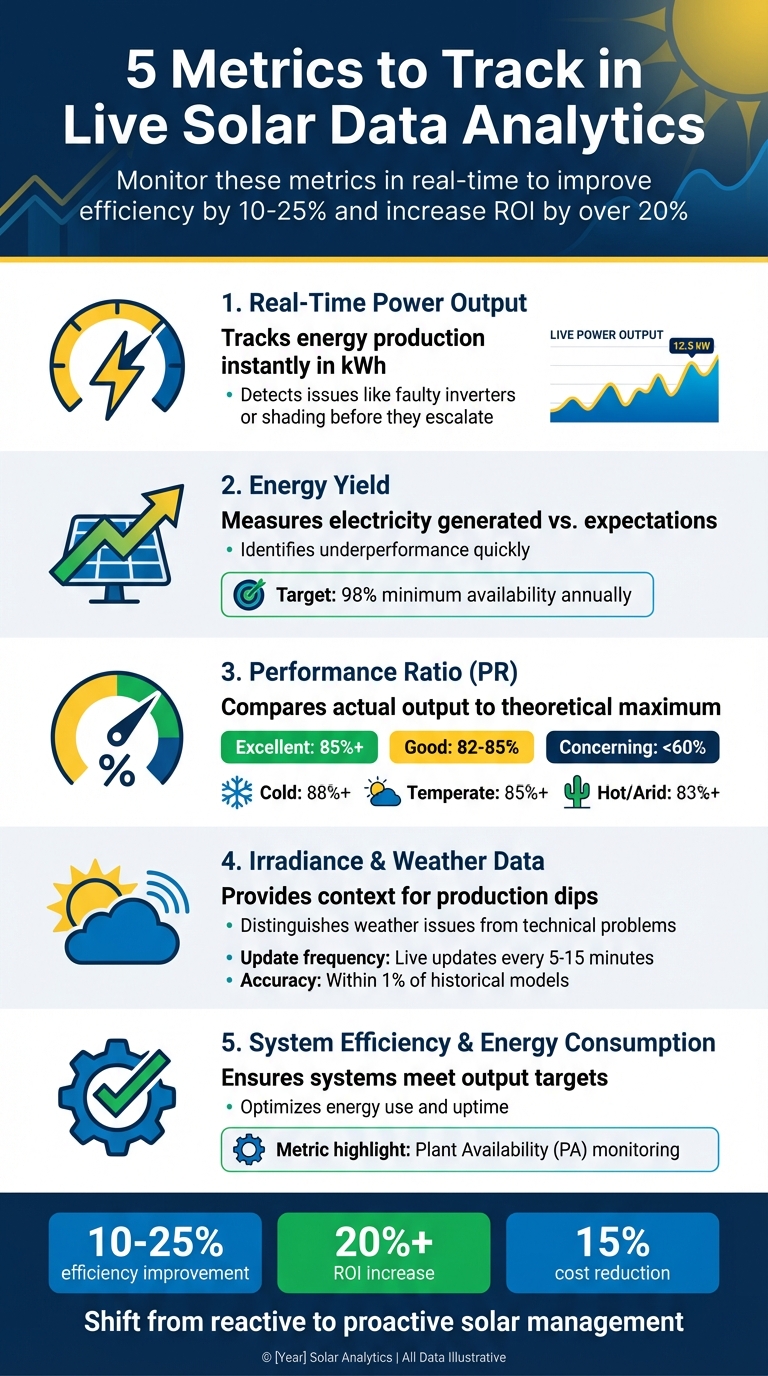
- Real-Time Power Output: Tracks energy production instantly, helping detect issues like faulty inverters or shading before they escalate.
- Energy Yield: Measures how much electricity the system generates compared to expectations, identifying underperformance quickly.
- Performance Ratio (PR): Evaluates system efficiency by comparing actual output to the theoretical maximum, independent of weather.
- Irradiance and Weather Data: Provides context for production dips, distinguishing between weather-related and technical problems.
- System Efficiency and Energy Consumption: Ensures systems meet output targets while optimizing energy use and uptime.
5 Essential Solar Data Analytics Metrics to Track in Real-Time
1. Real-Time Power Output
Real-Time Monitoring Capability
Real-time power output tracking gives you an up-to-the-minute view of energy production in kWh – not yesterday’s numbers or last week’s data. Modern systems now offer live insights into energy being sent to the grid, battery charge levels, and even the performance of individual panels using module-level monitoring. This level of detail makes it easier to catch issues like a single panel underperforming due to shading or dirt before it impacts the entire system’s output.
With mobile apps, system updates and alerts are delivered straight to your team’s phones. For example, if an inverter fails, production drops immediately, and the system sends an alert. This instant feedback allows for quick action, helping you address faults right away and optimize energy use.
Impact on Energy Optimization
Real-time tracking also plays a big role in load shifting strategies, helping to get the most out of every kWh generated. Since solar production usually peaks around midday, this data can guide customers to run energy-intensive appliances – like water heaters or HVAC systems – during those hours. By increasing direct solar consumption and reducing grid dependency, these strategies improve the overall return on investment for solar systems.
Actionable Insights for Solar Companies
Set up automatic alerts to catch production dips without needing constant manual checks. Weekly production reviews can help establish what "normal" performance looks like for each system. If you notice a low Performance Ratio (PR) – the measurement comparing actual energy output to expected levels – it’s a sign to take action.
"A poor PR indicates that technical difficulties are preventing an asset from operating at maximum efficiency, which can trigger the need for proactive servicing outside of the standard maintenance schedule." – Blu Banyan
sbb-itb-2560759
2. Energy Yield
Relevance to System Performance
Energy yield reflects the total electricity produced by a solar PV system, serving as a key indicator of whether the installation is meeting its production goals. It essentially measures how well the system performs compared to its design specifications and weather conditions. By monitoring this metric in real time, operators can confirm that the system is on track and aligned with the original project objectives.
"This KPI tracks the amount of energy that is being produced by the solar PV system. Solar project managers can use this KPI to ensure that the system is operating as expected and identify any issues that may be affecting its performance." – Blu Banyan
Real-time monitoring tools are particularly useful, as they allow you to compare actual energy production with forecasted values. This helps distinguish between production dips caused by weather, like cloudy conditions, and those stemming from technical issues that might need immediate attention. This level of insight is crucial for ensuring the system operates efficiently.
Impact on Energy Optimization
Tracking energy yield is not just about verifying performance – it also helps guide strategic adjustments. For example, specific yield, expressed as kWh per kWp installed, provides a normalized way to compare systems of different sizes. This metric can highlight underperforming components, such as an inverter that produces less energy than others in similar conditions.
The Energy Performance Index (EPI) is another valuable tool. It evaluates the actual yield against the expected output from your solar model, focusing on technical performance rather than weather-related variations. This makes it easier to pinpoint and address technical issues quickly. Industry benchmarks suggest aiming for a Performance Ratio of 82% for well-maintained systems and ensuring a minimum guaranteed availability of 98% annually.
Actionable Insights for Solar Companies
A drop in energy yield should signal the need for immediate maintenance. When a system produces less energy than expected, it not only impacts service levels but also eats into profits. Automating billing dashboards can streamline the process of tracking actual production versus guaranteed output, simplifying the calculation of performance guarantee refunds and improving transparency with customers. Combined with real-time power data, these insights enable quick operational adjustments to keep the system running smoothly and efficiently.
3. Performance Ratio
Relevance to System Performance
The Performance Ratio (PR) is a key metric for evaluating how efficiently your solar system converts sunlight into usable electricity, factoring in real-world conditions. It compares the actual energy output to the theoretical maximum based on current irradiance. By accounting for losses like temperature effects, inverter inefficiencies, cable resistance, soiling, and module mismatch, PR provides a clear picture of your system’s health, independent of weather variations.
"PR is the single most diagnostic metric in solar engineering. It’s how financiers evaluate bankability, how O&M teams detect underperformance, and how designers compare the quality of their work against industry benchmarks." – Atlas Bridge Team
A PR above 85% typically signals strong performance, while anything under 60% could point to serious issues like inverter malfunctions or disconnected strings. This makes real-time monitoring indispensable for spotting and addressing problems quickly.
Real-Time Monitoring Capability
Real-time tracking of PR allows you to distinguish between normal environmental fluctuations and actual system issues. For example, a drop from 93% to 82% might indicate problems such as shading, soiling, or inverter Maximum Power Point Tracking (MPPT) failures. Advanced solar business management software now automates this process, merging meter data with weather inputs to detect unusual declines.
PR naturally fluctuates with temperature, running higher in cooler months when panels operate more efficiently and lower in hotter conditions despite increased energy production. Recognizing these seasonal trends helps differentiate between expected variations and genuine system problems. Temperature effects alone typically account for 3–8% of annual output.
Impact on Energy Optimization
Monitoring PR helps identify specific loss factors – like soiling or conversion inefficiencies – so you can address them strategically to maximize returns. While a gradual PR decline of 0.3–0.5% per year is expected due to system aging, a drop exceeding 1% annually often signals issues such as cell cracking, connector wear, or inverter degradation. These insights directly affect financial metrics like Net Present Value (NPV) and Internal Rate of Return (IRR). For instance, a 5% PR shortfall can significantly delay your system’s payback period. Addressing abnormal losses promptly ensures smoother, more efficient operation.
Actionable Insights for Solar Companies
Declining PR should act as a red flag for initiating maintenance. For instance, servicing should be scheduled when PR falls below climate-specific benchmarks – 88%+ in colder regions, 85%+ in temperate areas, and 83%+ in hot, arid climates.
"A poor PR indicates that technical difficulties are preventing an asset from operating at maximum efficiency, which can trigger the need for proactive servicing outside of the standard maintenance schedule." – Blu Banyan
For companies managing multiple installations, comparing the PR of different plants or inverters can help pinpoint localized issues. Maintaining a high PR is as crucial as tracking Real-Time Power Output and Energy Yield for overall system performance. For future projects, you can improve PR by selecting panels with lower temperature coefficients (like N-type or HJT panels) and ensuring adequate ventilation (4–6 inches) behind rooftop panels to enhance cooling.
4. Irradiance and Weather Data
Relevance to System Performance
In addition to metrics like real-time power output and energy yield, irradiance and weather data provide crucial context for understanding system performance. Key irradiance metrics – Global Horizontal Irradiance (GHI), Direct Normal Irradiance (DNI), Diffuse Horizontal Irradiance (DHI), and Global Tilted Irradiance (GTI) – help determine the theoretical energy available. This distinction is essential for identifying whether production dips are due to weather conditions or equipment issues.
Satellites track cloud movements with a resolution of 1–2 km every 5 minutes, and this data is further refined to 90 meters for site-specific accuracy. Such precision enables operators to adjust for weather effects, isolating true equipment performance from environmental factors.
Real-Time Monitoring Capability
Live data updates – available every 5 to 15 minutes – enhance situational awareness, aiding grid adjustments and battery management. Tools like SolarAnywhere and Solcast deliver detailed irradiance data through user-friendly dashboards. These platforms allow users to visualize real-time Plane of Array (POA) irradiance alongside actual production metrics .
"High-frequency live solar data and PV power data keep your control room ahead of changing conditions." – Solcast
By inputting system parameters like tilt, azimuth, and module count, users can instantly compare estimated POA irradiance with actual production, offering a clear picture of system performance.
Impact on Energy Optimization
Operators can use real-time weather data to schedule energy-intensive tasks during peak solar production and quickly identify whether performance issues stem from technical faults rather than weather conditions. This data also helps grid operators and Virtual Power Plants (VPPs) manage unexpected changes, like sudden cloud cover, and optimize battery charging cycles based on current weather.
Additional metrics, such as snow depth and particulate matter (PM2.5 and PM10), guide maintenance planning. For example, cleaning and repairs can be scheduled only when environmental factors significantly reduce energy yield. Real-time GHI models now match historical model accuracy within 1%, making weather-adjusted performance estimates far more reliable than static projections. These improvements directly influence operational strategies and budget planning.
Actionable Insights for Solar Companies
Solar companies can use these data points to fine-tune maintenance strategies. By integrating live solar APIs, they can set up automated alerts for production dips that fall below weather-adjusted expectations, prompting timely maintenance. For instance, a drop in the Performance Ratio while live irradiance remains high could indicate issues like inverter faults or physical obstructions, signaling the need for immediate action.
For companies without on-site sensors, satellite-derived irradiance data offers a cost-effective alternative for benchmarking performance across multiple locations. Most live data services provide reliable API access in JSON or CSV formats, with uptime exceeding 99.99%, ensuring smooth integration with SCADA or asset management systems.
5. System Efficiency and Energy Consumption
Relevance to System Performance
System efficiency goes beyond just real-time production and the Performance Ratio – it involves keeping an eye on total kWh production to ensure systems are hitting their output targets. Another key metric here is Plant Availability (PA), which measures overall system uptime. This is crucial for meeting service level agreements and ensuring assets stay operational, which directly impacts reliability and performance.
Real-Time Monitoring Capability
Modern software tools now come equipped with real-time KPI dashboards that make tracking system efficiency a breeze. These dashboards allow operators to spot performance issues as they happen, enabling quick interventions before small problems grow into big ones. For instance, monitoring reliability metrics – like the number of system faults and maintenance expenses – helps companies fine-tune their servicing schedules and uncover cost-saving opportunities. These insights not only help avoid unnecessary expenses but also improve the overall return on investment. By identifying efficiency losses early, operators can address issues that might otherwise lead to increased energy consumption.
Impact on Energy Optimization
Efficiency monitoring plays a big role in shaping strategies for smarter energy use and grid interaction. For example, real-time monitoring enables load shifting, where users are encouraged to run energy-hungry appliances during peak solar production hours. This reduces dependence on the grid and maximizes the use of generated solar power. Additionally, analyzing grid energy flows helps refine battery discharge strategies and optimize time-of-use patterns. Catching efficiency drops early – whether due to shading, dirt buildup, or equipment wear – means quick corrective actions can prevent significant energy losses.
Actionable Insights for Solar Companies
Automated alerts within monitoring systems are a game-changer, notifying teams immediately when production falls below weather-adjusted expectations. This ensures technical issues are addressed promptly. Solar companies can also benefit from regularly reviewing financial metrics like ROI, Net Present Value (NPV), and Internal Rate of Return (IRR) alongside operational data. These reviews can uncover performance dips caused by usage trends, aging components, or outdated technology. Integrating these insights into maintenance plans helps maintain efficiency and protect profitability.
Conclusion
Keeping a close eye on these five metrics can significantly enhance system performance and profitability. When monitored together, they have been shown to improve overall efficiency by 10–25%, increase ROI by over 20%, and cut costs by around 15%. These improvements stem from addressing issues early, fine-tuning maintenance schedules, and making smarter choices about energy usage and grid interaction.
The secret lies in leveraging tools that make this data actionable right away. Blu Banyan’s SolarSuccess platform does just that by integrating live data from inverters and sensors into a cloud-based dashboard. This gives solar companies real-time visibility into key metrics like power output, yield, performance ratio, and system efficiency. With features like customizable alerts and mobile access, teams can tackle problems as they arise instead of waiting weeks for routine reviews.
"By tracking these KPIs on a regular basis, solar project managers can make course corrections as necessary to keep their projects on track and profitable." – Blu Banyan
This data-driven approach enables swift, measurable adjustments that can have a real impact. For instance, case studies reveal that real-time alerts have helped recover significant yield losses and boosted ROI by up to 18%. This shift from reactive to proactive management is transforming how solar companies operate.
FAQs
How do I set alert thresholds for PR and energy yield?
To define alert thresholds for Performance Ratio (PR) and energy yield, start by analyzing your system’s specifications alongside historical performance data. Use this information to determine what constitutes acceptable performance levels for your setup. Once established, set these thresholds within your monitoring platform, ensuring they are slightly below the expected performance values. This way, you’ll be notified promptly if performance dips, giving you the chance to address issues quickly and keep energy production running efficiently.
What’s the difference between energy yield and performance ratio?
Energy yield refers to the total energy a solar system generates over a set period – usually measured in kilowatt-hours (kWh) or megawatt-hours (MWh). This metric provides a straightforward way to gauge how much electricity the system produces.
On the other hand, the performance ratio (PR) measures how efficiently the system operates. It compares the actual energy output to the theoretical maximum the system could achieve under perfect conditions. PR is expressed as a percentage and factors in common real-world losses, such as:
- Temperature fluctuations
- Dirt or debris on panels (soiling)
- Inverter inefficiencies
Because it accounts for these variables, PR serves as an essential diagnostic tool for understanding and improving system performance.
Do I need on-site sensors to access live irradiance data?
No, live irradiance data can be accessed through remote sources and APIs such as SolarAnywhere. These tools deliver real-time solar data without the need for on-site sensors. This approach simplifies the process of monitoring and improving the performance of solar systems.