
Solar energy production reports are essential for tracking the performance and financial success of photovoltaic (PV) systems. These reports help identify issues early, optimize energy use, and ensure systems meet financial goals. Here’s a quick breakdown of the key metrics covered:
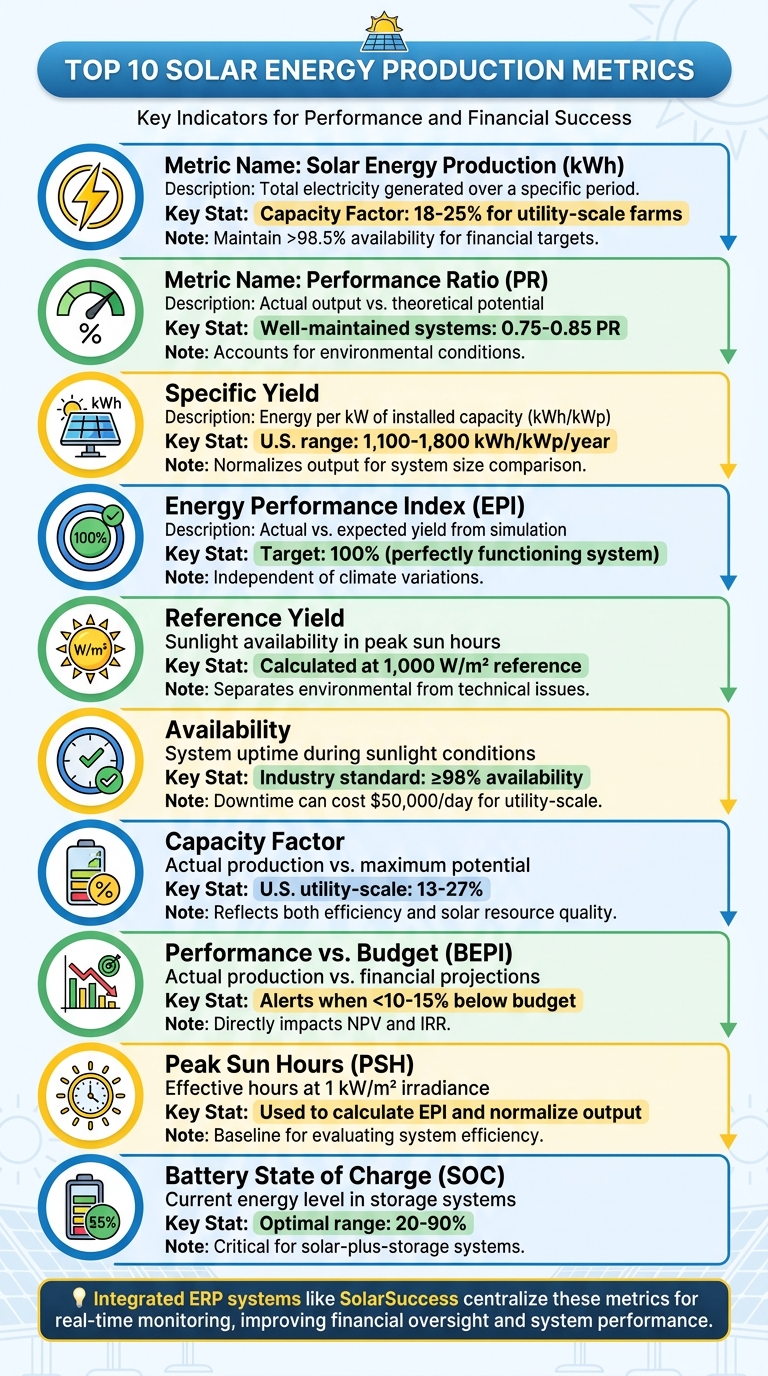
- Solar Energy Production (kWh): Tracks the total electricity generated, directly tied to revenue and operational efficiency.
- Performance Ratio (PR): Measures system efficiency, accounting for environmental conditions.
- Specific Yield: Normalizes energy output per kilowatt of installed capacity, useful for comparing systems of different sizes.
- Energy Performance Index (EPI): Compares actual performance to expected output, filtering out weather impacts.
- Reference Yield: Reflects sunlight availability, separating environmental effects from technical inefficiencies.
- Availability: Tracks system uptime to ensure energy generation during optimal sunlight conditions.
- Capacity Factor: Evaluates how much energy a system produces relative to its maximum potential.
- Performance vs. Budget (BEPI): Compares actual production to financial projections, highlighting underperformance.
- Peak Sun Hours (PSH): Analyzes sunlight hours to evaluate system efficiency.
- Battery State of Charge (SOC): Monitors battery energy levels in solar-plus-storage systems.
Integrated ERP systems, like SolarSuccess, centralize these metrics for real-time monitoring, simplifying maintenance, and improving financial oversight. Tracking these metrics ensures better system performance, cost savings, and stronger financial returns.
Top 10 Solar Energy Production Metrics for PV System Performance
1. Solar Energy Production (kWh)
Solar energy production, measured in kilowatt-hours (kWh), represents the total electricity generated over a specific period. This metric serves as the backbone for all performance calculations in solar energy reports.
Why It Matters for Operations
Monitoring kWh production at the inverter level provides real-time performance insights. By examining daily production curves, you can quickly spot irregularities, such as shading issues or dirt accumulation on panels.
Automated alerts can be set up to notify you when production falls below a set threshold. Additionally, comparing production across multiple inverters helps pinpoint underperforming components.
Impact on Financial and Performance Goals
The kWh output is directly tied to revenue generation. For utility-scale solar farms, the Capacity Factor typically ranges from 18% to 25%, meaning the system produces 18–25% of its maximum potential output over time. To meet financial targets and contractual obligations, maintaining system availability above 98.5% is critical.
This data also plays a key role in load management, ensuring efficient energy distribution.
Seamless Integration with Reporting Systems
Modern ERP platforms simplify the process by automatically collecting kWh data via inverters and utility-grade meters. This information is then displayed in real-time on dashboards and mobile apps. For professional operations and maintenance purposes, recording data at 15-minute intervals is recommended. Such detailed tracking enables precise performance analysis and supports the calculation of key metrics like Performance Ratio (PR), Specific Yield, and Capacity Factor (Plant Load Factor).
This metric forms the foundation for deeper analysis of advanced KPIs, which will be explored in later sections.
2. Performance Ratio (PR)
Performance Ratio (PR) is a key metric outlined in IEC Standard 61724-1. It measures how a photovoltaic (PV) system’s actual energy output stacks up against its theoretical potential. What makes PR so useful is that it removes the influence of changing sunlight levels, making it possible to compare systems operating in different locations or seasons. This makes it a cornerstone for assessing system performance.
Why PR Matters for System Performance
While metrics like kWh production show raw output, PR offers a more refined perspective by accounting for environmental conditions. It reflects the combined effects of system losses – whether from heat, shading, dirt, equipment issues, or downtime. For context, well-maintained crystalline silicon systems generally achieve PR values between 0.75 and 0.85. If PR dips below this range, it’s a red flag for potential system problems that need attention.
The formula for PR is straightforward: PR = Final Yield / Reference Yield. Here’s how it breaks down:
- Final Yield: Net AC energy output (kWh) divided by the system’s installed DC peak capacity (kWp).
- Reference Yield: In-plane irradiation (kWh/m²) divided by a standard irradiance of 1,000 W/m².
By focusing on these factors, PR filters out weather-related variations, offering a clearer picture of system efficiency.
How PR Adapts to Different Installations
PR isn’t limited to one type of solar project – it’s relevant for residential, commercial, and utility-scale systems. However, it has its quirks. For example, in hot climates, standard PR can underestimate performance because crystalline silicon modules lose around 0.35% to 0.45% of power for every degree Celsius above 25°C. To address this, temperature-corrected PR adjusts for these heat losses, providing a more accurate efficiency measure in warmer regions.
Seamless Integration into Reporting Tools
Calculating PR is relatively simple with modern tools. ERP systems use four main inputs: net AC energy output, plane-of-array irradiation, nameplate DC capacity, and reference irradiance. To ensure accuracy, data should be recorded at 15-minute intervals. Additionally, applying a 200 W/m² irradiance threshold helps exclude unreliable low-light data, resulting in dependable 30-day PR averages.
3. Specific Yield
Specific yield provides a way to compare solar systems of different sizes by normalizing energy production. It measures the total energy produced (kWh) per kilowatt of installed DC capacity (kWp) over a specific period. This makes it possible to directly compare systems, whether it’s a small residential setup or a large utility-scale installation. In the U.S., specific yield values typically range between 1,100 and 1,800 kWh/kWp/year, depending on factors like location and climate. By normalizing energy output, specific yield helps identify performance issues and improve system operations.
Significance for Operational Insights
Tracking specific yield at the inverter level can pinpoint underperforming parts of a solar plant. For instance, a system in a high-irradiance area like Phoenix will naturally have higher specific yield values compared to one in Seattle, as this metric reflects weather conditions. This makes it useful for identifying localized problems like shading, dirt accumulation, or equipment wear.
Here’s a simple example: If a 5 kW system generates 21 kWh in a day, its daily specific yield is 4.2 kWh/kWp (21 ÷ 5). However, unlike the performance ratio, a dip in specific yield might indicate a technical issue – or it could just be due to cloudy weather. That’s why it’s important to analyze specific yield alongside weather data for a complete picture.
Relevance for Financial and Performance Optimization
Specific yield is also a key metric for financial decision-making. Investors and lenders rely on it because it directly correlates to revenue and plays a major role in ROI calculations. If actual yields fall 10–15% short of projections after the first year, it’s a clear signal to conduct a technical review. Additionally, using P50/P90 specific yield estimates in long-term financial plans helps account for variability in production and ensures financial goals are met.
"Specific yield is the single most useful metric for comparing solar performance because it normalizes output against system size." – nu.energy
4. Energy Performance Index (EPI)
The Energy Performance Index (EPI), as outlined in IEC 61724-1:2021, measures the ratio of the actual specific energy yield to the expected yield predicted by a detailed PV simulation model. A perfectly functioning, defect-free solar plant should score 1.0, or 100%. Similar to metrics like kWh production and Performance Ratio, EPI focuses on technical performance while filtering out environmental influences.
One of EPI’s standout benefits is its independence from climate variations. Since the simulation model already factors in local weather and temperature conditions, EPI allows for valid comparisons across different seasons. This makes it easier to separate real technical issues from changes caused by external weather conditions.
Significance for Operational Insights
By calculating EPI at 15-minute intervals, operators gain a highly detailed view of a plant’s performance, far beyond what monthly or annual metrics can provide. This granular data makes it easier to spot short-term problems like soiling, shading, or component malfunctions that might otherwise go unnoticed in aggregated data. For instance, a sudden drop in EPI during morning hours could point to shading issues.
"EPI analysis can identify and quantify specific categories of losses – including soiling, shading, component failures, and availability losses – by comparing modelled versus actual loss profiles." – Solargis Technology
EPI also helps differentiate between physical faults and inaccuracies in energy budgets. Automated detection of grid outages, curtailment, and clipping enables operators to quickly identify issues such as tracker stalls or string outages. These insights, paired with integrated reporting tools, support faster responses to system deviations.
Ease of Integration into Reporting Tools
Incorporating EPI into solar ERP systems can significantly improve operational workflows by automating data analysis. However, this requires advanced software that can handle complex modeling and automated data cleaning. A reliable PV simulation model is crucial, along with a thorough understanding of the plant’s technical setup. Accurate solar radiation data – whether from satellite sources or ground measurements – is essential, as errors in this input can distort the EPI.
Modern ERP platforms, like SolarSuccess by Blu Banyan, simplify this process by offering KPI dashboards for one-click monitoring and quick issue detection. Configurable alerts can notify operators in real-time when EPI drops below a set threshold, enabling faster maintenance responses. This is especially important given the sheer volume of data generated by large solar portfolios.
Relevance for Financial and Performance Optimization
EPI plays a key role in aligning pre-construction energy yield estimates with actual performance after commissioning. This alignment helps refine long-term financial models by minimizing the impact of weather variability. EPI confirms whether an asset is performing as expected financially, strengthening investor confidence. If EPI values consistently fall short, it may signal the need for a technical review to prevent financial projections from being negatively impacted.
"The advantage of using the EPI is that its expected value is 100% at project start-up and is independent of climate or weather." – Solar Best Practices
EPI is becoming increasingly relevant in markets where high-efficiency modules with unconventional configurations are gaining popularity. As AI-driven models continue to improve the accuracy of yield predictions, EPI is set to become an even more integral tool for both operational and financial decision-making.
5. Reference Yield
Reference Yield (Y₍ᵣ₎) is a measure that shows how many hours of sunlight, at a reference irradiance level of 1,000 W/m², would be needed to produce the same amount of energy as the total sunlight received. It’s calculated by dividing the total in-plane irradiation (kWh/m²) by 1 kW/m², and the result is expressed in hours (h) or peak sun hours (PSH).
"The Reference Yield $Y_r$ represents the energy obtainable under standard conditions, with no losses, over a certain period $i$." – Solar Best Practices
This metric plays a key role in the Performance Ratio (PR) formula: PR = Y_f / Y₍ᵣ₎, where Y_f is the Final Yield. By accounting for weather variations, Reference Yield helps separate environmental impacts from technical inefficiencies, offering a clearer picture of system performance.
Significance for Operational Insights
Reference Yield is crucial for understanding system efficiency in the context of the available solar resource. It helps operators distinguish between performance dips caused by poor weather and those resulting from equipment issues. To ensure accurate calculations, IEC 61724-1 suggests using Class A pyranometers or reference cells installed in the plane of the array (POA). Additionally, a minimum irradiance threshold of 200 W/m² is recommended to exclude periods with high measurement uncertainty.
Ease of Integration into Reporting Tools
Modern ERP platforms make it easier to include Reference Yield in performance monitoring by linking to weather stations or satellite-based data. For instance, SolarSuccess by Blu Banyan automates this process with data collection and KPI dashboards that display Reference Yield alongside metrics like Final Yield and Performance Ratio. Accurate synchronization of data logger timestamps for irradiance and AC output – within ±1 second – is essential for precise PR calculations. Furthermore, these systems can estimate "Deemed Generation" (energy that could have been produced during grid outages) using the formula: 0.82 × Insolation × Capacity. This feature is particularly helpful for financial claims. With these tools, Reference Yield data becomes a seamless part of performance analysis.
Relevance for Financial and Performance Optimization
Beyond operational insights, Reference Yield is vital for financial planning and performance guarantees in EPC contracts, where a minimum annual Performance Ratio is often required. It also supports the calculation of "Expected Yield", which is derived by multiplying Reference Yield by the expected Performance Ratio. This baseline helps validate financial models and strengthens investor confidence by confirming that assets are performing as expected. In regions with high temperatures, strong irradiance can keep Reference Yield high, but thermal losses may lower the Performance Ratio, highlighting the importance of this metric in understanding efficiency.
6. Availability
Availability tracks how often your solar system is up and running when sunlight levels exceed a set minimum threshold. This threshold typically ranges from 50 to 70 W/m², and the metric ensures your system is capable of generating power during those times. The industry standard aims for at least 98% Minimum Guaranteed Contractual Availability over a year. This benchmark lays the groundwork for a more detailed look at system performance.
Significance for Operational Insights
Availability is more than just a number – it’s a window into your system’s operational health. It helps differentiate between planned maintenance and unexpected downtime. Two key measures are often used:
- Technical Availability: Focuses purely on uptime versus downtime under sunlight conditions that allow energy generation.
- Contractual Availability: Factors in agreed-upon exceptions like grid outages, extreme weather, or snow, providing a fairer evaluation of O&M provider performance.
For deeper financial analysis, Energy-based Availability comes into play. This method weighs downtime by its revenue impact – because losing power during peak sunlight hours hurts far more than downtime at sunrise.
"Solar project managers can use this KPI [Solar system uptime] to ensure that the system is available when it is needed and identify any issues that may be reducing its availability for customers." – Blu Banyan
To ensure accurate reporting, availability should be measured at the inverter level using 15-minute data intervals. Weighting each inverter by its installed DC power ensures that smaller failures don’t appear as significant as larger ones.
Ease of Integration into Reporting Tools
Modern ERP tools simplify availability tracking with advanced data collection and monitoring features. Platforms like SolarSuccess integrate IoT sensors, smart meters, and SCADA systems to provide real-time uptime data. These systems support industrial protocols such as Modbus, DNP3, and IEC 61850, ensuring smooth data flow.
Customizable dashboards display key metrics like Plant Availability (PA) and include automated alerts for quick action when availability drops below a set threshold. This minimizes delays in fault detection and resolution. Additionally, mobile access allows technicians to update system statuses and receive assignments on the go, even in remote locations.
Relevance for Financial and Performance Optimization
Unplanned downtime directly impacts financial metrics like IRR and NPV. For utility-scale projects, this can mean losses of up to $50,000 per day. Monitoring availability helps protect these financial indicators, maintain SLA compliance, and reassure investors. Predictive maintenance tools can further reduce maintenance costs by 20% to 30%, linking downtime to revenue loss.
Setting a clear availability target – such as 98% or 99% – gives operations teams a measurable goal. It also helps pinpoint whether issues are due to aging equipment or recurring technical problems, ensuring long-term performance and reliability.
sbb-itb-2560759
7. Capacity Factor (Plant Load Factor)
Capacity Factor (CF) measures how much energy a system actually produces compared to its maximum potential if it operated at full capacity all year. The calculation is simple: divide the annual energy output by the system capacity multiplied by 8,760 hours (the total hours in a standard year). For instance, if a 1 MW system generates 1,500 MWh in a year, its capacity factor would be 17.1%.
Why Capacity Factor Matters
Unlike the Performance Ratio, which adjusts for available sunlight, the Capacity Factor captures both the system’s efficiency and the quality of the local solar resource. For example, a poorly designed system in sunny Phoenix might still achieve a higher CF than a well-designed system in cloudier Seattle. Across utility-scale solar projects in the U.S., capacity factors generally fall between 13% and 27%.
When using this metric, it’s important to clarify whether you’re referring to the DC Capacity Factor (calculated as AC energy divided by the DC nameplate capacity) or the AC Capacity Factor (calculated as AC energy divided by the AC inverter rating). This distinction adds depth to system performance analysis, especially when paired with the Performance Ratio. Additionally, systems with high DC:AC ratios might experience inverter clipping during peak production, which can limit the Capacity Factor even in areas with high sunlight.
Financial and Performance Considerations
For investors and lenders, the Capacity Factor is a critical metric for financial modeling and production estimates like P50/P90, which are essential for solar project financing. Because it directly ties to revenue by showcasing the system’s operational potential, CF plays a central role in financial projections. However, it’s best used alongside the Performance Ratio to separate resource-related constraints from technical inefficiencies.
For systems with battery storage, it’s recommended to base CF calculations on "Net Annual Energy", which accounts for storage-related losses such as round-trip efficiency and discharge cycles. This method gives a more accurate view of the system’s true output and long-term financial performance. These insights can also be integrated into ERP dashboard analytics to enable real-time tracking of system performance.
8. Performance vs. Budget (BEPI)
Performance vs. Budget, commonly referred to as BEPI (Budget Energy Performance Index), compares actual energy production to the projections you planned for when making your investment. Instead of focusing solely on technical efficiency, BEPI evaluates how well your system is meeting the financial expectations you had at the outset. Essentially, it answers the question: Is your system delivering the financial returns you anticipated?
Significance for Operational Insights
BEPI is a key indicator for identifying technical issues that may be dragging down performance. If production falls short of the budgeted figures, it’s a clear sign that something – like equipment malfunctions, unexpected shading, or dirt buildup – is preventing your system from operating at its best. This metric is tied directly to your financial forecasts and service level agreements (SLAs).
"The performance ratio compares the actual electricity generated to predicted figures. Site layout and weather, among other factors, will reduce the actual performance of an asset so it is important to keep a close eye on performance trends to ensure profit targets are achieved." – Blu Banyan
Tracking BEPI at a portfolio level provides a clear view of which sites are falling short of their baseline projections. This helps you allocate maintenance efforts where they’re needed most. Beyond identifying site-specific issues, BEPI also offers insight into whether performance problems are isolated or systemic across your portfolio. This dual focus supports both operational troubleshooting and financial analysis.
Relevance for Financial and Performance Optimization
When BEPI reveals production shortfalls, the financial ripple effects can be significant. Reduced energy output directly impacts revenue and can hurt critical financial metrics like Net Present Value (NPV) and Internal Rate of Return (IRR). Regular reviews of BEPI help catch declining returns early, allowing for timely interventions.
Modern reporting methods use weather-adjusted energy budgets to factor in real-world conditions like irradiance and temperature. This ensures that true performance issues aren’t overshadowed by uncontrollable weather events. Automated alerts in monitoring systems can notify managers when production drops below a set percentage of the budget, helping to address minor issues before they escalate. Integrating BEPI into ERP dashboards further streamlines proactive management.
Ease of Integration into Reporting Tools
Specialized solar ERP platforms make it simple to monitor BEPI metrics. With built-in KPI dashboards, you can track performance vs. budget in just a few clicks. These tools pull real-time production data and compare it to your original financial models, helping you stay on top of profit targets. For instance, SolarSuccess by Blu Banyan incorporates BEPI tracking into its NetSuite-based platform, giving project managers instant access to budget variances without the need for manual calculations.
9. Peak Sun Hours
Peak Sun Hours (PSH) are a key metric for analyzing solar energy performance. They measure the total solar radiation a location receives, expressed as effective peak sun hours. In technical terms, PSH is represented as the Reference Yield (Yᵣ), which is the energy a system could produce under standard conditions (1 kW/m²) without accounting for losses. This is calculated by dividing the total in-plane solar irradiation (kWh/m²) by the reference irradiance (1 kW/m²).
Why PSH Matters for System Performance
PSH serves as a baseline for evaluating system efficiency. By comparing the actual energy yield to the reference yield, operators can identify the effects of losses like module degradation, temperature fluctuations, and dirt buildup. Modern monitoring tools use PSH data to differentiate between energy drops caused by low sunlight and those resulting from system issues like shading or equipment failures.
PSH also supports metrics like the Energy Performance Index (EPI), which measures system performance independently of weather conditions. EPI is calculated by dividing the observed Specific Yield by the Expected Yield (PSH multiplied by expected PR). An EPI of 100% shows the system is performing as expected, offering a reliable way to monitor operations and refine financial forecasts.
Simplifying Reporting with PSH Data
PSH data can be seamlessly integrated into solar ERP platforms, enhancing system monitoring and analysis. Solar-specific tools like SolarSuccess automatically pull irradiance data – either from on-site sensors or satellite sources – into asset management systems. This automation simplifies EPI calculations and normalizes output across multiple sites, making it easier to compare performance across different locations.
These platforms can also trigger maintenance alerts if actual energy production falls below PSH-adjusted expectations. For accurate tracking, temperature and irradiance data should be logged at least every 15 minutes.
Financial and Operational Benefits of PSH Tracking
Monitoring PSH is essential for aligning performance with financial goals. For example, in Performance vs. Budget (BEPI) analyses, PSH helps assess if a solar plant is meeting the financial benchmarks established during the investment phase. It also enables fair comparisons between different system types, like fixed-tilt and tracker installations, by normalizing performance metrics.
Including PSH and weather data in ERP dashboards provides real-time insights into project costs and profitability. This is especially critical since soft costs – such as administration, permitting, and financing – can account for up to 65% of the total cost of a new solar installation. By leveraging PSH data, operators can optimize both performance and financial outcomes.
10. Battery State of Charge (SOC)
Keeping an eye on battery performance is just as important as tracking solar production metrics when it comes to solar-plus-storage systems.
The Battery State of Charge (SOC) reflects how much energy a battery currently holds – either in kilowatt-hours (kWh) or as a percentage. Think of it as a real-time fuel gauge, giving you insights into backup power levels and the battery’s charge/discharge behavior.
Why SOC Matters for Performance
SOC acts as a key indicator of a battery’s health. For instance, if a battery fails to fully charge during peak sunlight or discharges unexpectedly, it might point to issues such as faults, shading, or wear and tear. To avoid damaging the battery, it’s crucial to maintain SOC within the manufacturer’s suggested range – typically 20% to 90%. Regularly reviewing SOC trends, ideally on a weekly basis, helps establish a baseline and catch potential problems early.
Role in Solar System Efficiency
In solar-plus-storage setups, SOC data plays a big role in optimizing energy use and cutting costs. By knowing exactly when energy is being stored or discharged, operators can adjust their usage patterns to match peak solar production. This ensures the battery is ready to meet high-demand periods. Tools like Enphase Enlighten, SolarEdge, and Tesla apps integrate SOC data, offering users a clear and detailed view of their energy systems.
Simplifying Reporting and Monitoring
SOC data can be seamlessly combined with solar generation and consumption stats on automated dashboards. This creates a well-rounded picture of system performance, complete with alerts for low battery levels. For commercial and industrial operators, platforms like Blu Banyan provide ERP dashboards that integrate SOC data. This eliminates the need for scattered spreadsheets, offering real-time insights into both operational and financial performance.
Boosting Financial and Operational Efficiency
Tracking SOC trends can uncover inefficiencies, like relying too heavily on costly grid power. Adjusting battery settings and energy usage based on this data can lead to significant savings. For example, some solar contractors have reported cutting their project-to-cash cycle by 40%, while advanced solar management tools have lowered installation soft costs by 3–5¢ per watt. Additionally, shifting energy-intensive activities – like running appliances – to daytime hours maximizes solar energy use while preserving battery power for when it’s most valuable.
Integrating SOC data into ERP dashboards not only improves operational awareness but also enhances financial decision-making, making it a critical tool for solar energy management.
Using ERP Dashboards to Track Metrics
Keeping tabs on critical solar energy production metrics can get overwhelming, especially if you’re relying on spreadsheets. Manual tracking is not only time-consuming but also prone to errors. That’s where an integrated ERP dashboard comes in. SolarSuccess by Blu Banyan simplifies this process by pulling data from accounting, project management, CRM, and inventory into one Oracle NetSuite-based platform. This setup gives solar businesses real-time insights into both their operations and finances, eliminating the hassle of juggling data from multiple systems. It’s a streamlined way to monitor all the key performance metrics we’ve touched on earlier.
The platform comes with solar-specific dashboards pre-configured with custom Key Performance Indicators (KPIs). These KPIs are tailored for different types of installers – residential, commercial, and utility-scale. There’s even an option to include weather portlets, which can help track how environmental factors affect production and project timelines. Plus, project milestones automatically trigger accounting events, syncing production metrics with financial data without needing manual updates.
Take Titan Solar Power, for example. In February 2020, the company replaced its fragmented, homegrown systems with SolarSuccess. Under the guidance of Aaron Casillas, their Technology and Infrastructure Director, they integrated their operations into a single platform. The results? Titan Solar Power significantly cut down on labor for partner commission payouts and sped up project installation times. As Casillas put it:
"With NetSuite, we’ve significantly decreased the amount of labor involved in paying out our partners and made that process very consistent across the board."
But it’s not just about data integration. Collaboration tools within the platform, like bluChat, make teamwork seamless by allowing teams to discuss project data directly inside the ERP system. Blu Banyan CEO Jan Rippingale highlights the benefits of this unified approach:
"Having everything connected makes a tremendous difference… it’s two different databases, with all the headaches that brings."
For solar businesses juggling metrics like Performance Ratio and Battery State of Charge, SolarSuccess turns raw data into actionable insights. This allows installers to make quicker, smarter decisions about system performance and profitability.
Conclusion
Keeping tabs on essential solar metrics helps you make quicker, smarter decisions that can directly impact your bottom line. Metrics like Performance Ratio, Capacity Factor, and kWh production give you the insights needed to spot underperforming systems, fine-tune maintenance schedules, and ensure your installations hit financial goals. By focusing on data, you can solve issues before they become costly problems.
This is where integrated ERP systems come into play. Solutions like SolarSuccess bring everything together – production metrics, financial data, project management, and inventory tracking – eliminating data silos and offering real-time visibility across your operations.
When data is consolidated, the results are actionable. Real-time dashboards make it easier to detect performance dips, helping recover up to 2-5% of lost production annually. Better project visibility also means more efficient allocation of resources. Companies using integrated ERP systems report a 25-35% boost in operational visibility and a 15-20% cut in manual reporting time.
The financial benefits are clear. For example, improving the Performance Ratio by just 5% across a portfolio of 100 systems could add an extra $50,000-$100,000 in annual revenue. Additionally, tracking KPIs can improve decision-making speed and accuracy by 18-30%. These kinds of gains can set thriving solar companies apart from their competitors.
For solar businesses aiming to scale efficiently, adopting a robust ERP system for metric tracking is the key to operational success and long-term profitability.
FAQs
What are the top 3 metrics for my solar production report?
The three most important metrics in your solar production report are availability, performance ratio (PR), and energy ratio. These metrics give you a clear picture of your system’s health and effectiveness:
- Availability: Tracks the system’s uptime, ensuring your solar panels are operational as expected.
- Performance Ratio (PR): Measures how efficiently your system converts sunlight into usable energy compared to its theoretical potential.
- Energy Ratio: Compares actual energy output to the expected output, helping you understand if the system is meeting its targets.
By focusing on these metrics, you can evaluate your system’s overall performance and pinpoint areas where improvements may be needed.
How often should I collect data for accurate KPI tracking?
To keep your KPI tracking on point and respond to issues quickly, it’s important to gather data on a regular basis – whether that’s daily or weekly. Consistent updates give you a clearer picture of performance trends and allow you to stay on top of operational efficiency.
How do I identify weather impacts versus system underperformance?
Comparing the system’s actual energy output with expected performance metrics, such as the Performance Ratio (PR) and the Energy Performance Index (EPI), provides valuable insights. These metrics take into account environmental factors and system losses, offering a clearer picture of how well the system is functioning. Regularly monitoring these indicators can help pinpoint whether deviations in energy output are due to weather fluctuations or potential issues within the system itself.