
I’d put it this way: solar teams can often spot faults 7 to 30 days before failure when they connect inverter, string, thermal, tracker, and weather data. That changes maintenance from a rushed repair into a planned visit with parts ready, less downtime, and lower cost.
Here’s the short version:
- I can use sensor signals instead of failure alarms to find trouble early.
- I need clean SCADA and IoT data, usually logged every 1 to 5 minutes, with 95%+ data completeness for prediction.
- I should build asset-level baselines by site, season, inverter, and string.
- I can turn raw readings into action with thresholds, anomaly detection, and thermal scans.
- I should send ranked alerts into work orders based on risk, asset criticality, and production loss.
A few numbers stand out:
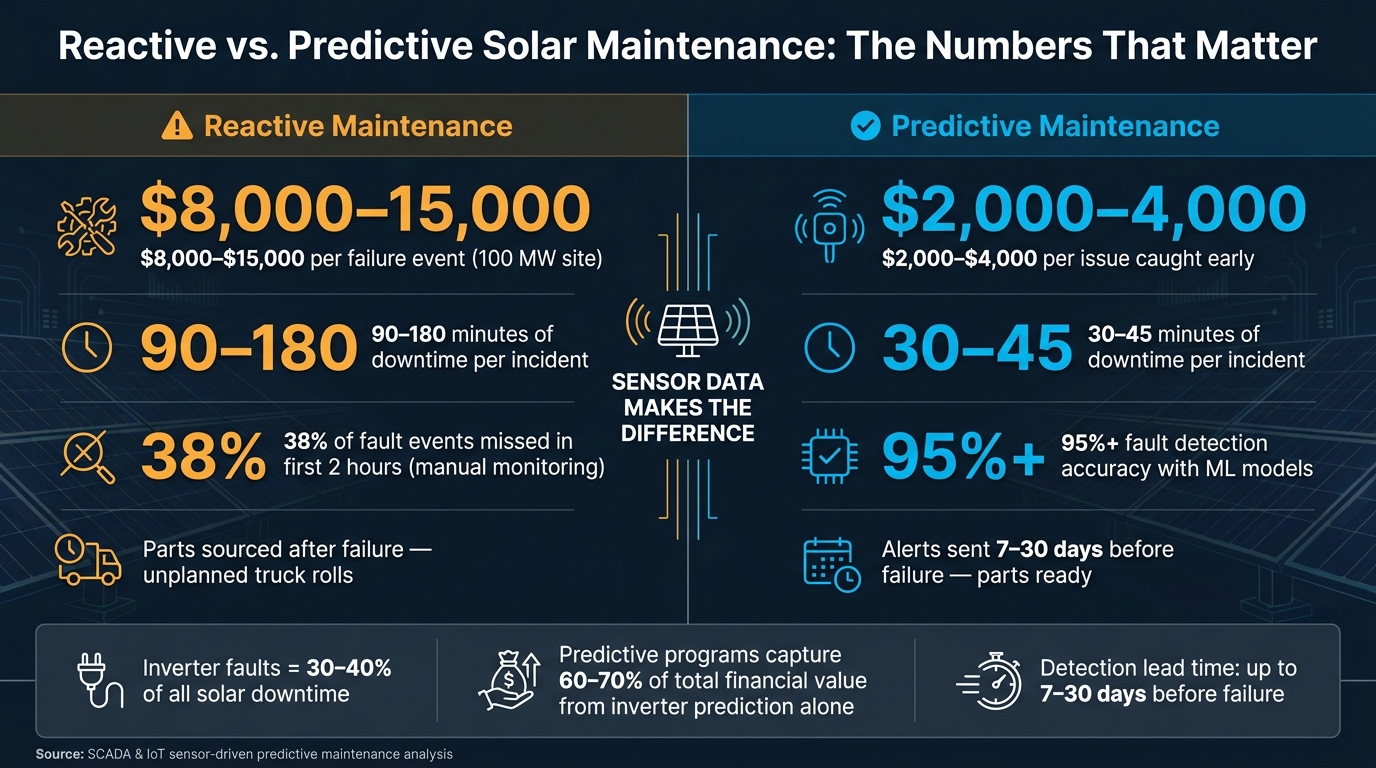
- A reactive event at a 100 MW site can cost $8,000 to $15,000
- The same issue caught early may cost $2,000 to $4,000
- Reactive incidents often cause 90 to 180 minutes of downtime
- Sensor-led maintenance can cut that to about 30 to 45 minutes
- Inverter issues drive 30% to 40% of solar downtime
If I boil the article down to one idea, it’s this: the sensors already do the watching. The main job is to clean the data, compare it to a normal baseline, and turn drift into work orders before output drops.
| Focus area | What to watch | What it can show |
|---|---|---|
| Inverters | Efficiency, heat, voltage ripple, error logs | Wear, cooling issues, failure risk |
| Strings & modules | Current, voltage, backsheet temperature | Soiling, connector issues, hot spots, diode faults |
| Trackers | Motor current, position error | Friction, actuator wear, misalignment |
| Weather & irradiance | POA irradiance, wind, humidity, rain | Normal vs. fault, soiling timing, corrosion risk |
| Analytics layer | Thresholds, anomaly models, IR review | Early fault flags and ranked maintenance actions |
So before getting into the details, the answer is simple: sensor data helps solar teams fix the right issue at the right time, before a breakdown turns into lost production and a higher bill.
Step 1: Identify the sensor data that supports early fault detection
Some sensor feeds give you an early warning. Others just tell you something already went wrong.
The goal is to focus on readings that shift before power output falls off. That’s where predictive maintenance starts to pay off. And it works best when you look at sensor feeds together, not one by one. A single reading can hint at a problem. A combined view usually tells the real story.
Core solar data points to monitor
Irradiance is the starting point for everything else. A plane-of-array pyranometer helps you tell the difference between a weather-related dip and an equipment issue. Without that baseline, it’s hard to know whether lower production is normal or a sign of trouble.
Inverter data is often where the money is. Internal temperature, DC-to-AC conversion efficiency, error logs, and DC bus voltage ripple tend to show trouble early. For example, a small 2% efficiency drop over two weeks, or higher operating temperatures at night, can point to capacitor or IGBT wear 7 to 14 days before failure. That matters because inverter failures drive 30% to 40% of all solar downtime, so many operators begin here.
String-level current and voltage readings help you compare parallel strings under the same irradiance. If one string keeps running below the others, that can signal soiling, shading, a corroded MC4 connector, or a bypass diode issue. Module backsheet temperature gives you another clue. If one module runs about 27°F hotter than nearby modules under the same irradiance, that can point to a bypass diode failure or a hot spot that’s starting to form.
Tracker sensors add the mechanical side of the picture. Motor current draw and position accuracy can show wear long before a tracker stops stowing or lining up the way it should. If motor current starts climbing, friction or gear resistance may be building. Position errors past ±2° can point to actuator or drive gear wear that may turn into a full failure in 30 to 60 days.
Map each sensor type to likely failure signals
This is where context matters. Most sensors become much more useful when you compare them against irradiance data or a known baseline.
| Sensor Type | What It Measures | Issue It Helps Detect |
|---|---|---|
| Inverter Sensors | AC/DC power, temperature, efficiency, ripple | Inverter failure, capacitor wear, cooling fan degradation, ground faults |
| String Sensors | DC current and voltage | Soiling, shading, MC4 connector corrosion, bypass diode failure |
| Pyranometers | Irradiance (GHI/plane-of-array) | Underperformance vs. baseline, soiling accumulation |
| Temperature | Module backsheet vs. ambient air | Hot spots, bypass diode failure, thermal runaway |
| Tracker Sensors | Motor current, position accuracy | Actuator wear, drive gear resistance, misalignment |
| Weather Stations | Wind speed, humidity, rain | Tracker wind-stow triggers, corrosion risk, soiling reset timing |
| Thermal (Drone) | Infrared signatures across module surfaces | Delamination, micro-cracks, cell-level hot spots |
| IV Curve Tracer | Current-voltage response per string or module | Fill factor reduction, micro-cracks, series resistance increase |
Use PR as a portfolio-level screen. After temperature normalization, 75%–85% usually points to acceptable performance.
Once these signals are mapped, the next job is to pull them into a clean baseline layer.
Step 2: Build a reliable data collection and baseline layer
Collect data from IoT devices, SCADA feeds, and monitoring systems
Once you know which sensors matter, the next job is simple in theory and messy in practice: get all of those readings into one place.
SCADA systems pull real-time telemetry from inverters, weather stations, power meters, and tracker controllers into a single view. That matters because bad inputs lead to false alerts, while clean inputs make early fault detection possible. After data is centralized, you need to make sure it’s clean enough to trust.
On multi-vendor sites, that’s not always easy. Different hardware often uses different protocols, such as Modbus, DNP3, and IEC 61850. So the collection layer needs to support those protocols and provide clean API access to keep data integrity intact across sources.
For trend analysis, SCADA data is usually logged at 1- to 5-minute intervals. Some high-availability setups poll every 5 to 15 seconds. That gap matters. If your data arrives late, arrives in the wrong format, or disappears for chunks of the day, your analytics stack starts working with noise instead of signal.
Predictive models need more than 95% data completeness. And the cost of poor collection shows up fast: sites that depend on manual report reviews instead of real-time monitoring miss 38% of fault events in the first two hours.
That’s why automated validation checks should sit inside the collection layer before data reaches analytics tools. For example, if the system logs negative irradiance during daylight hours, that value should be filtered out right away. If not, one bad reading can ripple through your dashboards, alerts, and model outputs.
Set historical baselines for normal performance
Clean collection only helps if each reading has something solid to compare against.
Raw data becomes useful when you build baselines that reflect normal performance for each site, inverter, string, and season, not just a fleet-wide average. A fleet average can look neat in a dashboard, but it often hides what’s normal at the asset level. And that’s where fault detection either works or falls apart.
Whether you’re commissioning a new system or using historical SCADA logs from an existing site, give the system enough clean operating data before turning on predictive alerts. If you skip that step, the model may treat routine behavior like a fault.
Baselines should account for seasonal Performance Ratio (PR) variation, temperature normalization, and site soiling patterns. Otherwise, a normal summer efficiency dip can look like equipment trouble when it isn’t. These baselines are what support the thresholds, anomaly detection, and thermal analysis in Step 3.
One common failure point is data flow integrity at point mapping. Wrong Modbus mapping or bad data-type handling can introduce errors that skew baseline values. This is the kind of issue that looks small at first and then keeps showing up later as “mystery” anomalies. It’s much easier to catch mapping problems early than to spend weeks figuring out why healthy equipment keeps getting flagged.
With clean data and baselines in place, the next step is turning those readings into maintenance signals.
Step 3: Turn raw sensor readings into maintenance signals
Raw readings don’t mean much on their own. They need context before they can turn into alerts that an operations team can use.
Once you have baselines, the job is simple in theory: spot deviations, decide which ones matter, and turn those into alerts people can act on.
Use thresholds, anomaly detection, and thermal analysis
Start with fixed limits for voltage, efficiency, current, and temperature. Then set alerts for sustained breaches, not one-off blips. Monitoring systems can flag readings that cross those limits. For example, if a string’s DC current drops 15% or more below its statistical baseline for a sustained period, that’s a signal worth checking.
Thresholds are useful for known failure modes. But they have a blind spot. They often miss quieter issues that don’t blow past a hard limit.
That’s where anomaly detection comes in. Instead of asking, “Did this number cross a line?” it asks, “Is this behavior normal for this asset right now?” It compares a reading with the asset’s usual pattern under current conditions, including irradiance, temperature, and seasonal shifts. That helps screen out weather-driven dips and cuts false alarms. Baselines show what normal looks like; analytics points out what drifts from it.
For larger fleets, machine learning can spot fault patterns across many signals at once. That matters because some failures don’t show up in just one metric. These models can classify fault types with over 95% accuracy and send alerts up to 7 days before failure.
Thermal and infrared analysis helps with fault types that electrical data alone can’t show. Drone-captured IR imagery, processed by AI, can automatically classify hotspots, bypass diode failures, and delamination, flagging hotspots, bypass diode failures, and delamination within hours.
Use sensor signals, not calendars or failures, to trigger work
Finding faults is only half the job. After that, you need to sort them by risk.
Route alerts based on risk, asset criticality, and expected production loss. Then send the right ones into work orders. That way, teams act on sensor signals instead of waiting for a calendar date or a full failure to force their hand.
Step 4: Set alert rules, prioritize work, and connect actions to operations
Alerts should turn into assigned work, not just sit in a dashboard. Once you rank them, the next move is simple: send them straight into work orders.
Prioritize alerts by risk, asset criticality, and expected production loss
Set separate thresholds for string-level and site-level alerts. Then sort them by risk, asset criticality, and expected production loss. After that, look at the component’s role in site output. If one asset going down hits production hard, it belongs near the top of the queue.
Inverters should usually come first. They drive 30% to 40% of all solar downtime, and strong inverter prediction can capture 60% to 70% of the total financial value of a predictive maintenance program. On a 100 MW site, one reactive maintenance event can cost $8,000 to $15,000 per failure.
Here’s how common fault types line up with realistic detection windows and priority levels:
| Fault Type | Asset | Detection Lead Time | Priority Level |
|---|---|---|---|
| Arc Fault / Overheating | Junction Box / Inverter | Immediate | Critical (Safety) |
| Inverter Efficiency Drop | Inverter | 7–14 days | High (Production) |
| Tracker Motor Wear | Tracker | 30–60 days | Medium (Urgency) |
| Soiling Accumulation | Modules | Days/Weeks | Low (Routine) |
It also helps to convert alerts into dollar terms. That way, teams aren’t guessing. If a maintenance manager can see that one flagged inverter is causing daily production loss, sending a crew stops feeling like a judgment call and starts feeling obvious. That keeps priority tied to dispatch, not just visibility on a screen.
Route alerts into work orders and feedback
Once an alert is ranked, it needs to move automatically into a work order. Manual handoffs eat up time and create mistakes. A better setup is to map SCADA anomaly triggers straight into work orders with the asset ID, fault code, required parts, and labor tracking.
A good starting point is review mode. In that setup, alerts wait for human review before a work order goes out. That gives the team time to build trust in the system. After that, you can shift to auto-dispatch mode, where the system sends work orders directly.
After dispatch, the job isn’t done. Field results need to flow back into the alert rules. Use those results to confirm or reject the fault, then adjust thresholds and cut false alarms. Over time, that means better threshold accuracy and fewer unnecessary truck rolls.
Conclusion: Build a sensor-driven maintenance process that improves solar asset performance
Taken together, these steps turn sensor data into a maintenance system that can act before equipment fails. The process comes down to four moves: pick the right sensors, bring clean SCADA and IoT data into one place, set asset-level baselines, and use anomaly detection to spot early drift.
When the system finds an anomaly, send it straight into a work order with the asset ID, fault type, and priority already attached. That way, technicians don’t have to piece things together in the field. As they log repairs in the CMMS, that data goes back into the models, helping improve future prediction accuracy and cut false positives.
The result is straightforward: less unplanned downtime, lower O&M costs, and more energy yield. The sensors are already there. The edge comes from using their data to make earlier calls, avoid more failures, and run sites better.
FAQs
What data quality is needed for predictive maintenance?
Predictive maintenance depends on accurate, steady, easy-to-access, high-frequency, time-stamped data. Without that, it’s hard to build a reliable baseline for what normal operating behavior looks like.
Quality control needs to keep data completeness above 95%. It should also include regular sensor calibration to stop drift, automated validation to filter impossible values and sensor errors, and clear ways to handle data gaps, such as linear interpolation or K-Nearest Neighbor.
Which solar assets benefit most from sensor-based monitoring?
Sensor-based monitoring matters most for high-value, high-impact assets. In solar, that usually means central inverters, where a single failure can disrupt a big part of site output and create serious operational headaches.
Other assets also deserve close attention, including solar panels, batteries, solar trackers, and power electronics. Real-time data from these components helps teams catch anomalies early, make maintenance more efficient, and improve long-term performance across a solar portfolio.
How do predictive alerts become maintenance work orders?
Predictive alerts turn into maintenance work orders by connecting IoT sensors, AI-driven analytics, and an ERP system.
Here’s how it works: sensors pick up signs of trouble like overheating, unusual vibration, or drops in performance. Then machine learning reviews that data to check whether a fault is starting to develop.
Once that happens, the system can automatically create a work order in the ERP. That work order can include the asset ID, fault details, and the parts needed, which helps managers send technicians out fast without manual data entry.
