
If I wait for solar equipment to fail, I lose energy, time, and money. A predictive maintenance program helps me spot panel, inverter, tracker, and soiling issues before they turn into downtime.
Here’s the short version:
- Solar output slips slowly from micro-cracks, PID, soiling, and heat stress
- Inverters drive 30%–40% of outages, so they are often the best place to start
- Soiling can cut annual generation by up to 25%
- Manual diagnostic visits average $500 each
- AI-based fault models can detect issues up to 7 days early
- Predictive programs can cut maintenance costs by 25%–40%
- A 75 MW site using 12,000 sensors cut unplanned downtime by 47% and saved $425,000 per year
- For a 10 MW portfolio, annual savings often land around $80,000 to $150,000
What this means for me is simple: I stop relying on fixed schedules and last-minute repairs. Instead, I use sensor data, SCADA, weather, service history, and financial impact to decide what to clean, what to repair, and when to replace parts.
Here’s the core shift:
| Approach | What happens | Common result |
|---|---|---|
| Reactive | I act after failure or output loss | More downtime, more lost revenue |
| Calendar-based | I service equipment on a fixed schedule | Extra site visits and missed issues between checks |
| Predictive | I act when data shows a fault forming | Lower downtime, better repair timing, tighter O&M spend |
The article shows how predictive maintenance helps me connect field alerts with work orders, parts planning, and budget decisions across the full solar asset lifecycle.
The Main Problems in Solar Panel Lifecycle Maintenance
These risks get expensive fast when teams don’t spot them early or tie them to a clear next step.
Hidden Degradation and Slow Performance Loss
Solar panels usually lose output little by little, and a lot of that drop is hard to see. Micro-cracks, PID, and soiling can drag down production for months before anyone flags the issue. In dry climates, soiling alone can cut annual generation by up to 25%. That creates a tough maintenance problem: the loss keeps piling up quietly, and by the time it shows up in reports, yield may have been slipping for weeks.
Manual inspections don’t fill that gap very well. There’s simply too much time between site visits, and the cost adds up across a big portfolio. A manual diagnostic visit averages $500 per visit [2].
When teams miss that slow decline, the next step is often the one nobody wants: a reactive work order.
Reactive Work Orders, Downtime, and Lost Energy Production
Inverters are the biggest source of unplanned downtime. They account for 30% to 40% of all solar outages. Even so, many operators still wait for an alarm or a visible output drop before they act. The problem? By then, the system has already been underperforming.
At a 5 MW commercial site, one failure can lead to lost revenue of $60,000 to $140,000. And old-school reactive monitoring often doesn’t catch problems until performance has already fallen by 15% to 30%. That’s a painful delay.
There’s another issue here. Inverters often need replacement after 5 to 10 years, which means failures can open up costly gaps long before the panels themselves are near end of life.
Things get messier when alerts, service history, and money data all live in different places.
Fragmented Data Across Operations, Finance, and Field Service
SCADA, field service, and finance systems often don’t talk to each other. When that data stays split up, teams struggle to turn alerts into repair priorities. They also miss the chance to pre-order parts before a planned visit, which can turn a simple fix into extra truck rolls and more downtime.
This split becomes an even bigger problem when a manufacturer goes bankrupt, which is a real risk in a market with heavy turnover. If records are scattered, warranty claims can become hard to track and even harder to file in time.
In one 984 kW system, reactive maintenance left failed panels undetected for years and led to avoidable replacement and credit losses [2].
That’s why predictive maintenance needs to connect asset data with scheduling, service, and financial planning.
How Predictive Maintenance Solves Lifecycle Problems
When data is connected across operations, the next move is simple: decide what to fix, clean, or replace first. That’s where predictive maintenance comes in. It turns early warning signs into scheduled work across the portfolio instead of forcing teams to react after a failure hits.
Using Data to Detect Failures Before They Spread
Predictive maintenance uses asset data to spot trouble before faults spread. The main inputs include inverter telemetry, SCADA logs, irradiance, ambient temperature, maintenance history, and soiling data. Put together, those signals show what normal performance looks like and help teams catch deviations early.
Machine learning models can flag developing faults up to 7 days before a failure occurs. That kind of lead time changes the whole maintenance picture. Instead of an emergency truck roll, teams can plan the repair, line up parts, and send the right crew on schedule.
The payoff can be big. A 75 MW installation that deployed 12,000 distributed sensors saw a 47% drop in unplanned downtime and $425,000 in annual savings within one year.
That same stream of data also helps answer another costly question: when should cleaning or inspection happen?
Adjusting Cleaning, Inspection, and Replacement Schedules
Predictive maintenance doesn’t just spot failures. It also helps schedule cleaning, inspection, and replacement only when asset condition calls for it.
AI cleaning schedules use weather and soiling data to estimate when output loss is high enough to justify service. At the Shams Solar Outdoor Facility at GUtech, research based on 235,297 observations found that predictive soiling models could cut unnecessary cleaning operations by about 30% while improving annual energy yield by 3%–5% under high-soiling conditions [3].
That matters because cleaning too early wastes labor and money. Cleaning too late cuts production. Predictive scheduling helps land in the middle, where service timing matches asset condition.
The same logic applies to replacement planning. Condition-based decisions can extend asset life and reduce premature component swaps, which has a direct effect on lifecycle cost across the portfolio.
Reducing Downtime and Prioritizing High-Value Repairs
Once a fault is detected, the next issue is priority. Not every problem carries the same production or revenue hit. Predictive maintenance helps teams rank repairs based on output and revenue at risk, so crews go first to the assets that matter most.
A failing inverter at a high-output site, for example, should move ahead of lower-impact issues somewhere else. That focus makes sense because inverters account for 60%–70% of the total financial value of a predictive program.
Continuous monitoring also shrinks response times in a big way. In one documented project, predictive maintenance reduced service response times from 72 hours to just 4 hours.
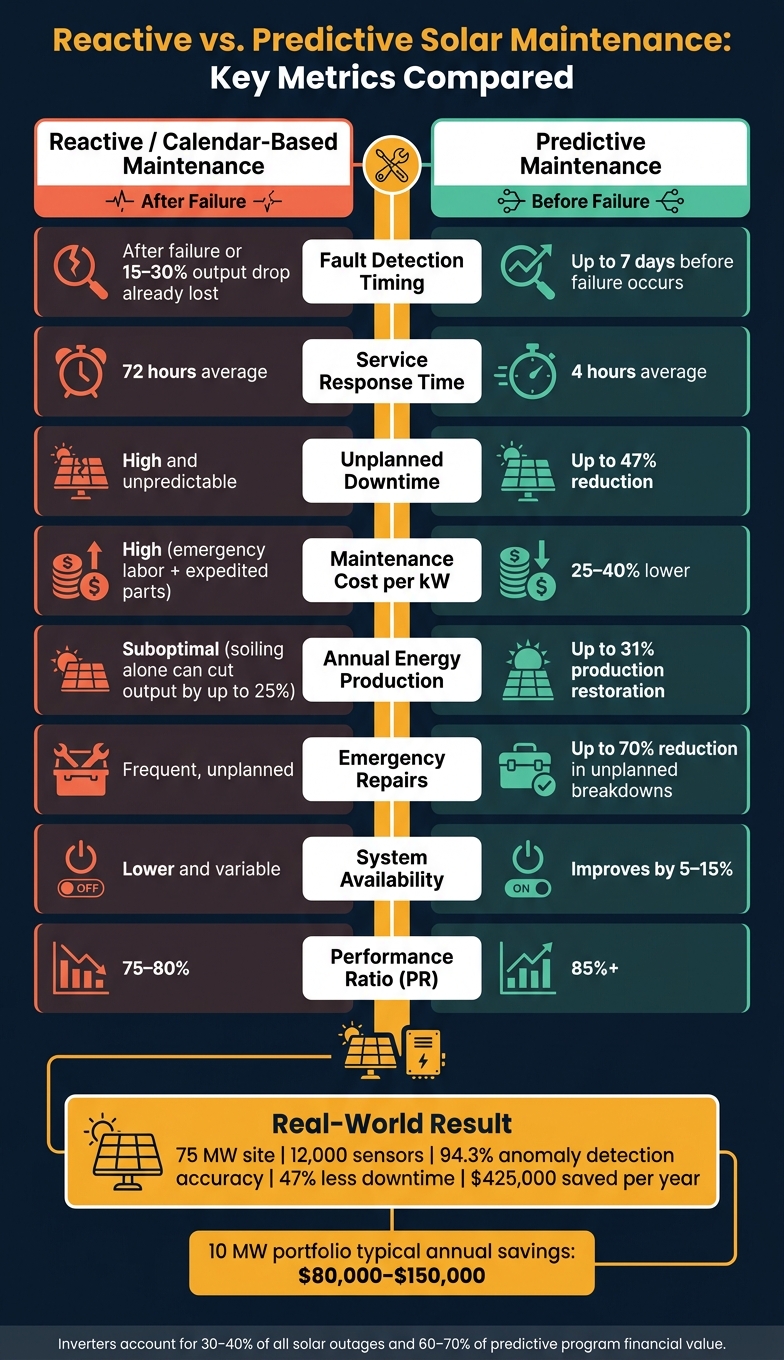
| Metric | Reactive Maintenance | Predictive Maintenance |
|---|---|---|
| Downtime | High (unplanned) | Low (scheduled) |
| Annual Energy Production | Suboptimal | Maximized (up to 31% restoration) |
| Maintenance Cost per kW | High (emergency repairs) | 25%–40% lower |
| Service Response | 72 hours (average) | 4 hours (average) |
“AI-driven predictive maintenance can reduce maintenance expenses by up to 40%, enhance equipment life by 20–30%, and boost overall operational efficiency by 25%.” – Deloitte (2023 Market Report)
Lower emergency labor, fewer truck rolls, and faster repair cycles cut lifecycle cost. Across a large portfolio, even small inefficiencies add up fast, so getting repair timing and repair priority right can make a major difference.
Building a Predictive Maintenance Program in a Solar Business
A predictive maintenance program that works across many sites needs reliable data, connected processes, and teams that know how to use both. The aim isn’t to flood people with alerts. It’s to help them make faster, better calls across the full asset lifecycle.
Data, Sensors, and Analytics Requirements
Every predictive program starts in the field, with instrumentation you can trust. The core setup usually includes voltage and current sensors at the string or module level, ambient and back-sheet temperature sensors, and irradiance sensors such as pyranometers or calibrated reference cells.
At tracker-equipped sites, you also need to watch motor current, position accuracy within ±2°, and gearbox vibration. Those signals can flag early mechanical wear before it turns into a bigger failure.
It also helps to track every inverter and tracker in a structured asset model with full service history. That way, you’re not looking at isolated alerts with no context. You’re looking at each signal alongside what happened before, what was repaired, and how the asset has been performing over time.
Before turning on machine learning alerts, collect 6 to 12 months of clean historical data. That baseline is what lets the system define normal performance ranges for each asset. Without it, alerts can get noisy fast.
For mixed hardware fleets, SCADA needs to pull together Modbus, DNP3, and IEC 61850 data in one platform. If your systems can’t talk to each other, your team ends up stitching the story together by hand. That’s slow, and it often leads to missed issues.
A practical place to begin is with inverter alerts. Inverters carry the highest downtime risk and usually offer the richest fault data, which makes them the best starting point for predictive monitoring.
Those signals only help if they move straight into maintenance and budget decisions.
Connecting Maintenance Workflows to ERP and Financial Planning
When a fault alert shows up, it should create a work order in the ERP automatically, with the asset ID, fault description, and priority level already filled in. That cuts out manual handoffs and gives the team a clear next step right away.
Predictive systems that provide 7 to 30 days of lead time before failure give procurement teams time to pre-order parts and stage inventory. That buffer can reduce emergency shipping costs, which add up fast when a site is down.
It also makes sense to convert alerts into estimated revenue loss per day. Once operations and finance can see the dollar impact, they can rank repairs by ROI instead of reacting to whatever alarm came in last.
A solar ERP such as Blu Banyan‘s SolarSuccess can keep alerts, work orders, inventory, and project financials in one system. That matters because fragmentation is a common headache in solar operations. Service history sits in one tool, cost data in another, and scheduling somewhere else. When that happens, people waste time chasing data instead of fixing assets.
Improving Team Coordination and Execution
Even the best alerting system falls flat if teams don’t read signals the same way. O&M teams need training on how to interpret alerts, including when a signal points to a confirmed fault and when it simply calls for more investigation.
Technicians should confirm or reject predicted faults in the field, and that feedback should go back into the model to reduce false positives over time. In plain English: the system gets better when the field team closes the loop.
Shared metrics also help keep operations, finance, and asset managers aligned on repair priorities and lifecycle outcomes. When everyone works from the same data, repair decisions get less political and more grounded in asset performance and cost impact.
Blu Banyan’s tools can support that workflow with chat, document management, and time tracking in one system.
Conclusion: What Predictive Maintenance Changes Across the Solar Asset Lifecycle
Taken together, these changes move maintenance from reaction to prevention. Predictive maintenance swaps reactive and calendar-based service for condition-based action. Across the asset lifecycle, it gives teams up to 7 days of lead time to plan repairs before failures spread.
A 2025 case study shows what that looks like in practice. At a 75 MW site using 12,000 sensors and AI/ML, the system reached 94.3% anomaly-detection accuracy, cut unplanned downtime by 47%, and saved $425,000 per year. That’s a big change in O&M economics.
Those gains show up in a few core operating metrics:
| Lifecycle Outcome | Before (Reactive/Calendar-Based) | After (Predictive Maintenance) |
|---|---|---|
| Performance Ratio (PR) | 75–80%, often dragged down by soiling and undetected faults | 85%+, maintained through real-time condition monitoring |
| Emergency Repairs | Frequent; triggered by system trips or stoppages | Up to 70% reduction in unplanned breakdowns |
| Availability | Lower and more variable because issues are addressed after they escalate | Improves by 5% to 15% with predictive maintenance |
| O&M Costs | Unpredictable; spikes driven by emergency labor and expedited parts | More stable; targeted labor only when needed |
At portfolio scale, the money impact is just as clear. For a 10 MW portfolio, predictive maintenance usually leads to $80,000 to $150,000 in annual savings. That gives operations and finance teams a number they can plan around. It also turns O&M into a stronger driver of asset value, while helping with replacement timing, warranty recovery, and capital planning.
FAQs
How do I know if predictive maintenance will pay off for my solar site?
Predictive maintenance pays off when the gains from higher uptime and longer asset life are greater than the cost to put it in place. That’s why it helps to review your site’s performance data closely. Look for early warning signs of wear or failure, like inverter stress or panel soiling, before they turn into expensive unplanned outages.
The payoff can be big. Predictive maintenance can cut maintenance costs by up to 40% and reduce downtime by as much as 70%. Blu Banyan’s cloud-based solutions also give teams real-time visibility, which helps them make smarter budget decisions and improve returns.
What data do I need before starting predictive maintenance?
Start with data you can trust. If the numbers are off, everything that follows gets shaky fast.
That means using accurate, steady data that reflects asset health across a few core areas:
- Electrical data like voltage, current, and power output
- Thermal data such as panel temperature and ambient temperature
- Environmental data like irradiance, humidity, wind speed, and atmospheric pressure
- Imaging data and inverter operational logs
It also helps to set clear collection protocols from day one. Decide how data will be gathered, how often it will be checked, and who owns each part of the process. Without that, even good systems can turn messy.
On top of that, put quality controls in place to deal with missing data, sensor drift, and other gaps that can skew the picture. A small sensor issue might not look like much at first, but over time it can throw off analysis in a big way.
Which solar assets should I monitor first?
Start by looking at your infrastructure and pinpointing the parts that would cause the biggest operational hit if they failed.
Inverters should sit at the top of that list. They’re the most failure-prone balance-of-system component and the biggest driver of unplanned downtime.
From there, you can feed sensor data into an ERP system, such as those offered by Blu Banyan, to help guide maintenance decisions.