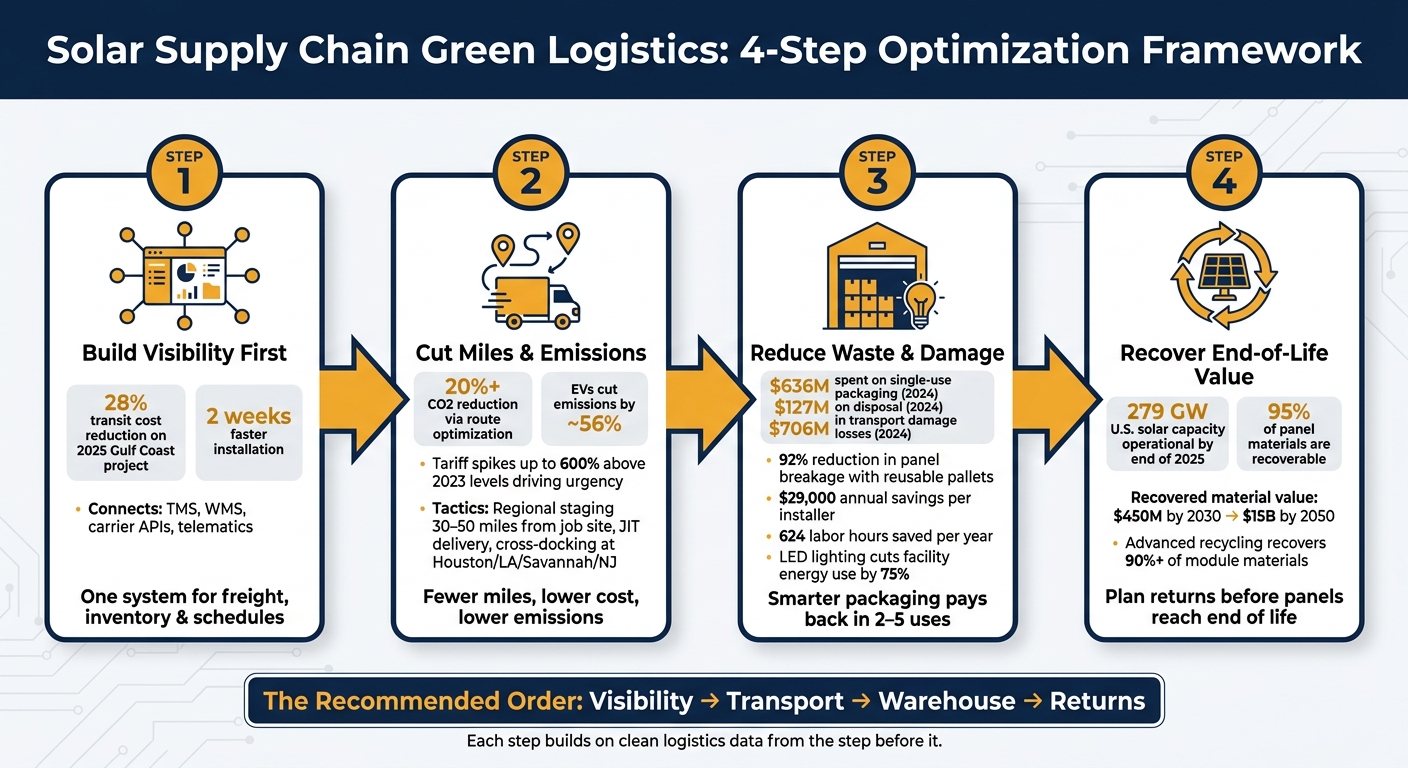
If I had to sum it up in one line: solar firms cut cost and emissions fastest when they fix visibility first, clean up transport next, tighten warehouse waste after that, and plan returns before equipment reaches end of life.
Here’s the short version:
- ERP and visibility tools help me track freight, inventory, and project timing in one place.
- Transport changes usually have the biggest effect on Scope 3 emissions and can cut route emissions by 20%+.
- Staging, JIT delivery, and cross-docking can also lower freight spend. One 2025 Gulf Coast project cut transit costs by 28% and finished two weeks earlier.
- Warehouse and packaging fixes trim energy use, damage, and disposal costs. In 2024, U.S. solar firms spent $636 million on single-use packaging and $127 million on disposal.
- Reverse logistics matters because about 95% of a solar panel’s materials can be recovered, and recovered material value could hit $450 million by 2030.
What I see in this comparison is simple: you do not need to do everything at once. Start with data and shipment visibility. Then cut miles, idle time, and handling. Then tighten packaging and end-of-life recovery.
Quick Comparison
| Area | Main goal | Best use case | Main payoff | Main hurdle |
|---|---|---|---|---|
| ERP and visibility | One view of freight, inventory, and schedules | Distributors, O&M teams, large EPCs | Fewer manual errors, tighter planning | Clean data and implementing solar ERP software |
| Low-carbon transport | Cut freight miles and mode waste | Manufacturers, developers, distributors | Lower transport cost and lower emissions | Carrier, route, and mode coordination |
| Warehousing and packaging | Cut energy use, damage, and waste | Regional hubs, staging yards, project sites | Lower handling loss and disposal spend | Facility changes and 3PL coordination |
| Reverse logistics | Recover value from used panels and parts | Asset owners, EPCs, installers | Lower waste cost, better recovery | Serial tracking and recycler network |
If you want the shortest path to action, I’d use this order: visibility, transport, warehouse, returns.
1. Integrated ERP and Visibility Platforms for Solar Logistics
Spreadsheets and separate carrier portals make solar logistics hard to see in real time. Teams end up guessing where freight is, what inventory is available, and how transport choices affect emissions. That lack of visibility gets in the way of lower-emission planning.
Integrated ERP and visibility platforms fix that by pulling procurement, inventory, transportation, and project schedules into one shared system. With one data source, teams can stage modules better, coordinate job-site deliveries with less friction, and track emissions without chasing data across tools.
Integrated platforms also use telematics to collect live driver and shipment status. That makes dynamic route optimization possible and helps fleets use vehicles more efficiently. When tools stay disconnected, carbon data stays trapped in silos. And when that happens, spotting emission hotspots – and doing something about them – gets much harder.
Emissions Reduction
These platforms support greener logistics by automating shipment consolidation based on weight, packaging, and routing. Put simply, they help companies combine loads in smarter ways. That can reduce empty miles and cut emissions across a large shipping network.
Cost and Service Impact
The upside isn’t just about carbon. A 2025 Gulf Coast solar project cut transit costs by 28%, sped up installation by two weeks, and removed demurrage by coordinating logistics, inventory, and scheduling in one system. When the same system also shows transport options clearly, lower-carbon choices become much easier to carry out.
Data and System Requirements
For these platforms to work well, they need integrated TMS, quoting, booking, and tracking across transport modes. API automation for quoting, booking, and tracking also cuts manual work and reduces errors.
For solar companies dealing with UFLPA compliance, it helps to keep tariff data and forced-labor traceability data in that same system. Why? Because it can prevent stranded freight and avoid the added emissions that come from detained or rerouted containers. Manufacturers also need lifecycle emissions data and carbon data sharing across partners to meet ESG disclosure rules.
Fit by Solar Business Model
EPCs and large developers tend to get the most value from project-based staging and JIT delivery workflows. Distributors often see the biggest gains from load consolidation and multimodal freight comparison.
Across all business models, central data helps teams make better mode choices, plan site staging with more accuracy, and find emission hotspots faster.
Once logistics data sits in one place, the next step is clear: pick cleaner routes, modes, and delivery patterns.
2. Low-Carbon Transportation and Distribution Strategies
When logistics data lives in one system, the big win shifts from simply tracking freight to designing a lower-carbon network. That usually comes down to two things: where inventory sits and when shipments move. In plain English, the goal is to move material through the network with the fewest wasted miles, delays, and handoffs.
Regional staging, JIT delivery, and cross-docking all help on that front. Staging inventory 30–50 miles from the job site cuts long-haul trucking needs. Releasing shipments weekly, based on what install crews need, reduces idle time and site congestion, which helps trim both emissions and cost. Cross-docking at coastal hubs like Houston, Los Angeles, Savannah, or New Jersey keeps freight moving from ocean to inland transport with less delay. It also helps avoid demurrage and reduces emissions tied to extra handling.
One Gulf Coast project shows how this can play out on the ground. A September 2025 Gulf Coast project used Houston cross-docking and 30-mile site staging to cut transit costs by 28%, speed installation by two weeks, and eliminate demurrage fees.
Emissions Reduction
Regional staging and JIT delivery cut emissions by shortening freight distance and removing extra truck moves. Cross-docking also helps by reducing waste from freight that gets stranded or handled twice. For small components and ESS parts, parcel service can make more sense than truck freight.
Cost and Service Impact
Lower-carbon routing doesn’t just affect emissions. It changes the math of the project, too. Tariff spikes on Southeast Asian panels have reached as high as 600% above 2023 levels in some cases. That kind of pressure can hit budgets hard. Staging, JIT, and cross-docking help counter some of that strain by reducing transport cost and schedule risk while also cutting emissions.
Data and System Requirements
A TMS should compare LTL, FTL, parcel, and drayage options for each shipment. That gives teams a clearer view of the best shipping path for cost, timing, and network flow. API automation for quoting, booking, and tracking also cuts manual mistakes and makes multi-stop coordination across distribution points much easier.
Fit by Solar Business Model
The right setup depends on how a company ships and stages equipment.
- Developers and EPCs tend to get the most from staging and JIT delivery.
- Distributors moving high volumes tend to get the most from cross-docking and automated quoting.
3. Energy-Efficient Warehousing and Packaging Systems
After transport, warehousing and packaging are the next big emissions targets. Warehouses can waste a lot of energy in solar logistics. And in solar supply chains, warehouse performance affects both delivery speed and total emissions. So this is the next place to cut waste, lower emissions, and reduce handling damage.
Inside the facility, energy use usually comes from lighting, climate control, material movement, and storage design. The biggest wins tend to come from LED motion controls, smart HVAC zoning, and solar-plus-storage. These changes can cut facility energy use without changing core operations. On large-roof facilities, solar-plus-storage can also support EV charging infrastructure.
Emissions Reduction
Inventory layout matters more than it may seem. A smart layout can cut travel time inside the warehouse, which lowers energy use at the same time. ASRS and AMRs help by reducing forklift travel and shrinking floor space needs.
Cost and Service Impact
Packaging is also a major cost center. In 2024, the U.S. solar industry spent $636 million on single-use packaging and $127 million on disposal. Transport damage added another $706 million in losses.
Reusable packaging helps on both cost and service. It can speed up staging, reduce damage claims, and keep install crews moving. It also makes staging areas safer and cleaner by removing broken wood and loose nails.
Stateline Solar, a Midwest installer, switched to PVpallet’s Series X reusable pallets and saw a 92% reduction in panel breakage, a projected $29,000 in annual savings from lower disposal and labor costs, and 624 labor hours saved per year by removing trash handling and pre-kitting modules.
Reusable packaging often pays back within 2 to 5 uses and can reduce project waste fast. The next piece is measurement: if you can’t track the gains, it’s hard to keep them.
Data and System Requirements
A WMS, IoT sensors, and AI tools that right-size packaging based on product dimensions can work together to automate storage, flag waste in real time, and reduce material use at scale. RFID tags or QR codes on reusable containers help keep those assets in circulation and reduce loss.
Fit by Solar Business Model
These upgrades don’t fit every solar operation in the same way.
| Facility Type | Best-Fit Strategies |
|---|---|
| Coastal/Import Hubs | High-speed automation to support high-volume import flow and minimize storage time |
| Regional Distribution Centers | Solar-plus-storage and HVAC optimization for controlled regional inventory |
| Project-Centric/Local Staging | Reusable packaging, smart laydown areas, and RFID asset tracking |
Coastal import hubs get the most from high-speed automation because it keeps freight moving and cuts storage time. Regional distribution centers, especially those with large roof areas and permanent climate-controlled zones, are strong fits for solar-plus-storage and HVAC optimization. Project-centric facilities tend to get the most value from compact layouts, reusable packaging, and fast container turnaround.
4. Reverse Logistics and Circular Recovery Programs
End-of-life panels, inverters, and batteries don’t just disappear. They create a reverse flow of material that can be recovered, reused, or recycled. And that means traceability matters just as much here as it does on the way in.
By the end of 2025, the U.S. had 279 GW of solar capacity in operation. At the same time, about 95% of a solar panel’s materials are recoverable. That recoverable material is expected to be worth $450 million by 2030 and $15 billion by 2050.
Emissions Reduction
Recycling outcomes vary a lot depending on how the return process is set up. Advanced recycling can recover more than 90% of a module’s materials, while partial recycling may send up to 70% of a panel’s mass to landfill.
That gap matters. If the return flow is messy, slow, or poorly tracked, material recovery stalls fast.
Cost and Service Impact
The math is starting to shift. Reverse-logistics economics are getting better as the industry moves toward landfill parity – the point where recycling costs line up with basic disposal costs.
In March 2026, Prologis, which manages more than 1 GW of installed solar and battery storage across its U.S. portfolio, signed an exclusive recycling agreement with Solarcycle to handle end-of-life panels at scale. The idea is simple: steady material volume can lower per-unit processing costs.
That approach started showing up earlier. In mid-2025, Solarcycle piloted an upfront recycling-cost provision with Engie North America across four projects. This built recycling logistics and costs into the original Power Purchase Agreements (PPAs). For developers, that means end-of-life costs are planned at the start instead of becoming a surprise years later.
Data and System Requirements
Reverse logistics lives or dies on chain-of-custody data tied to solar business management software and recycler networks. Without that link, it gets hard to tell what can be reused, what stays under warranty, and what drops into a lower-value recycling stream.
For example, panels may have barcodes removed for proprietary reasons. That can knock them out of reuse or warranty programs and push them into lower-value recycling paths.
Field handling also matters more than it may seem. Standard operating procedures (SOPs) should cover protective removal and transport, including steps like using foam-lined containers to reduce secondary breakage. If a panel breaks during decommissioning, it may fail TCLP testing and be reclassified as hazardous waste. When that happens, disposal costs can jump sharply.
One of the clearest checks is to ask recycling partners for mass balance audit data. In plain terms, that means asking how much module weight leaves the process as glass, metals, and residual waste.
“If a recycler doesn’t track things like share of module weight leaving as glass, metals and residual waste, that says something.” – Scott Azevedo, Supply Chain Executive, Intertek CEA
The right setup depends on who owns the assets and how spread out the return volumes are.
Fit by Solar Business Model
Different solar business models run into different reverse-logistics issues. Residential installers usually deal with small, scattered return volumes, so field SOPs matter most. The goal is to remove panels carefully enough that they can still be sold or donated into secondary markets.
Commercial EPCs have more control earlier in the project. They can build design for deconstruction into procurement by choosing modules with standard framing and non-toxic components. That can reduce recycling costs later.
Asset owners and operators, especially those managing large distributed portfolios, tend to get the most from single-provider recycling agreements. Those agreements help create predictable return volumes and lower per-unit costs.
| Business Model | Best-Fit Recovery Strategy |
|---|---|
| Residential Installers | Field SOPs for protective removal; secondary market resale or donation |
| Commercial EPCs | Design for deconstruction; upfront recycling-cost provisions in project agreements |
| Asset Owners/Operators | Exclusive recycler agreements; mass balance auditing; PPA-integrated recycling |
How Each Strategy Performs Across Key Decision Factors
No single strategy wins everywhere. The four options – integrated ERP and visibility, low-carbon transportation, energy-efficient warehousing, and reverse logistics – each solve a different part of the problem. What works best depends on what you care about most: emissions, cost, data setup, or fit with your business model.
Emissions Reduction
For most solar companies, transportation is the biggest Scope 3 emissions source. That makes low-carbon transportation the biggest lever. It changes how goods move by adjusting mode, route, carrier, and fleet mix. Route optimization software alone can reduce CO2 from delivery vehicles by 20% or more.
| Strategy Area | Primary Scope | Emissions Mechanism | Estimated Impact |
|---|---|---|---|
| Integrated ERP & Visibility | Scope 3 | Route optimization; load consolidation | Up to 20% CO2 reduction via routing |
| Low-Carbon Transportation | Scope 3 | Mode shifts; carrier and mode selection; EV fleet adoption | EVs cut emissions nearly 56% |
| Energy-Efficient Warehousing | Scope 2 and Scope 3 | LED retrofits; project-centric staging; fewer long-haul miles | LED lighting cuts facility energy use by 75% |
| Reverse Logistics | Scope 3 | Avoids landfill transport; groups returns to minimize trips | Supports circular recovery and waste avoidance |
The pattern is pretty clear. If you want the biggest direct hit on logistics emissions, start with transportation. Warehousing matters too, especially when better staging reduces extra miles and site delays. Reverse logistics plays a different role. It may not always show the same immediate emissions drop, but it helps cut waste and reduce disposal-related transport.
Cost and Service Impact
Lower emissions do not always mean the fastest payback. In practice, low-carbon transportation and efficient warehousing often show value first. Reverse logistics tends to pay off later, mostly through recovered materials and avoided waste costs.
| Strategy Area | Upfront Investment | Operating Savings | Delivery Reliability | Time to Value |
|---|---|---|---|---|
| Integrated ERP & Visibility | Moderate (software/API setup) | High (labor and error reduction) | High (real-time tracking) | Weeks to months |
| Low-Carbon Transportation | Low (process change) | Very high (28% to 50% transport cost cuts) | Improved (reduced transit time) | Immediate (per shipment) |
| Energy-Efficient Warehousing | Moderate (staging/3PL fees) | High (zero demurrage; JIT savings) | Very high (site-ready delivery) | Short (project-based) |
| Reverse Logistics | Moderate (collection setup) | Long-term (waste avoidance; recovery value) | Long-term only | Long-term |
This is where tradeoffs get real. A transportation shift can cut both cost and emissions at the same time, which is why it often gets attention first. Warehousing can also pay off fast when it prevents demurrage, reduces handling, and keeps deliveries aligned with project schedules. ERP and visibility tools take a bit more setup, but they can reduce manual work and shipment mistakes across the board.
Data and System Requirements
The more advanced the strategy, the more it depends on clean, connected data. Integrated ERP and visibility platforms ask the most from your systems. They pull data from TMS, WMS, carrier APIs, and IoT telematics, then tie it together in one place. A central solar ERP should connect project demand, inventory positions, logistics events, and reporting data.
| Strategy Area | Core Systems Needed | Key Data Inputs | Solar-Specific Integration |
|---|---|---|---|
| Integrated ERP & Visibility | ERP, TMS, control tower, carrier APIs | GPS, telematics, Scope 3 metrics, shipment milestones | Project demand forecasting; logistics event tracking |
| Low-Carbon Transportation | Route optimization, fleet management, multimodal TMS | Traffic patterns, carrier capacity, EV charge levels | Jobsite delivery windows; port cross-dock coordination |
| Energy-Efficient Warehousing | WMS, IoT sensors, staging management tools | SKU dimensions, motion sensor data, inventory turnover | Solar serial-number tracking; regional stocking levels |
| Reverse Logistics | RMA portals, serial-number tracking, refurbish/recycle workflows | Serial numbers, material composition | End-of-life panel recovery |
Put simply, some strategies are easier to start than others. Transportation changes can begin with process updates and carrier choices. ERP-led visibility is more powerful, but it needs connected systems and good data hygiene. If your shipment data is messy, the software will not fix that by itself.
Fit by Solar Business Model
The best option also depends on where your logistics bottleneck sits. For some companies, the pain point is global freight. For others, it’s staging, last-mile delivery, or returns handling.
| Business Model | Best-Fit Strategy | Operational Focus |
|---|---|---|
| Manufacturers | Low-Carbon Transportation | International air/sea optimization; carrier network management |
| Distributors | Integrated ERP & Visibility | Regional module and inverter stocking; high-volume LTL and parcel management |
| EPCs / Utility-Scale Developers | Energy-Efficient Warehousing | Project staging and JIT delivery |
| Residential & C&I Installers | Reverse Logistics + JIT | Urban last-mile constraints; end-of-life module collection |
| O&M Organizations | Integrated ERP & Visibility | Asset health tracking; spare parts inventory; technician scheduling |
A manufacturer moving freight across oceans has a very different problem from an installer trying to hit a tight delivery window in a city neighborhood. That’s why strategy fit matters so much. Distributors and O&M teams often get the most from visibility and inventory coordination. EPCs usually care most about staging and site-ready delivery. Installers, meanwhile, have to deal with both last-mile friction and end-of-life pickup.
Pros and Cons
Use this section to compare each strategy by implementation burden, not just emissions impact. The table below lays out the tradeoffs.
| Strategy Area | Major Benefits | Main Constraints | Best-Fit Scenarios | Maturity Stage |
|---|---|---|---|---|
| Integrated ERP & Visibility | High visibility; compliance automation; reduced manual errors | Requires clean, connected data; high change management effort; staff retraining | Distributors, manufacturers, and utility-scale developers managing complex multi-partner lanes | High maturity |
| Low-Carbon Transportation | Large emissions cuts; lower long-term fuel costs | High upfront capital for EV infrastructure; charging infrastructure gaps; EV rollout can extend lead times | Utility-scale developers and manufacturers with bulk freight, or urban low-emission-zone last-mile delivery | Moderate to high |
| Energy-Efficient Warehousing | Lower facility energy use; reduced transit costs and faster installation schedules | Upfront retrofitting costs; requires energy audits before investing; 3PL coordination | Residential EPCs and C&I installers using project-centric staging and JIT delivery | Intermediate |
| Reverse Logistics | Strengthens circularity; recovers materials; supports regulatory compliance | Depends on established recycling partner networks; needs serial tracking; regulatory complexity | Manufacturers and distributors with end-of-life module or battery recovery programs | High maturity |
The biggest differences come down to data readiness, capital intensity, and operating complexity.
Data quality is the bottleneck across all four areas. Integrated solar business management software needs clean inputs to work well. Reverse logistics relies on serial tracking. Warehouse staging falls apart fast if inventory data is off. Different strategy, same old problem: bad data makes everything harder.
From an execution standpoint, low-carbon transportation and warehousing upgrades often show returns sooner. ERP platforms and reverse logistics programs usually pay off more for companies that already have strong internal processes and connected systems. The thread running through all of this is operational visibility.
Conclusion
No single green logistics move will produce measurable results by itself. The best results come from moving in stages: visibility first, then optimization, then recovery. That order matters. Each step relies on clean logistics data from the step before it.
In practice, connecting transport workflows to your ERP or TMS through API automation cuts manual errors, gives you real-time tracking, and builds the data base that the rest of the process depends on. From there, local staging and just-in-time releases can reduce miles, cost, and schedule drag while helping you strike the right balance between emissions and service. Then you can tighten packaging and recovery workflows.
At this point, platforms like Blu Banyan‘s SolarSuccess can support that step-by-step path by connecting inventory, project schedules, and operations in one system. That helps teams support JIT delivery and sustainability reporting.
Visibility leads to optimization. Optimization leads to circularity. Companies that treat these as connected stages shaped by their business model and data readiness are the ones that keep cutting costs and emissions at the same time.
FAQs
Where should a solar company start first?
Start with a strong supply chain plan built around visibility, flexibility, and lower-impact operations.
Better visibility matters first. With real-time digital tracking, teams can spot disruptions early, keep component movement in sync, cut risk, and help orders arrive on time.
Then build more resilience with regional or local supply chains, automation, demand forecasting, diversified sourcing, and greener logistics practices like freight consolidation, fewer empty runs, and more efficient transportation.
Which green logistics changes save money fastest?
The biggest savings often come from just-in-time delivery and staging inventory close to project sites. In practice, these moves can cut transit costs by up to 28% and help crews move through installation faster, based on recent industry practices.
How do you track solar panels for recycling?
Track solar panels for recycling by separating, sorting, and storing damaged or end-of-life panels. Then work with accredited U.S.-based recyclers so materials can be recovered and any leftover waste can be handled the right way.
A lot of companies set up recycler relationships early in the project lifecycle too. That simple step can make the whole process run more smoothly once panels need to be removed, shipped, and processed.