
If your solar team waits for someone to check a dashboard, you can lose revenue for hours or days. I’d sum it up this way: real-time alerts cut the gap between fault start and repair, which helps protect uptime, energy yield, and O&M spend.
Here’s the core idea in plain English:
- Dashboards show data. Alerts drive response.
- Small faults can drain revenue just like big outages if they sit too long.
- Telemetry loss is a major risk because bad or stale data can hide a site problem.
- Good alert rules matter: too loose, and you miss faults; too tight, and teams get noise.
- ERP-connected alerts save time by creating tickets, linking assets, and routing work to the right person.
- Teams should track results with KPIs like availability, MTTR, MTTA, kWh yield, and O&M cost per kW.
A few numbers stand out:
- Power shortfalls of 10%–20% can point to underperformance
- Sudden drops of 30%–50% often signal equipment issues
- Missing telemetry for 5–15 minutes may need action
- Temperature readings around 149°F–158°F can signal heat risk
- Better alert logic can help avoid losses tied to delayed response, including around $42,000 per 100 MW per year in missed faults and lagging follow-up
Here’s the bottom line: monitoring only helps when it leads to action. I’d use modeled production, irradiance, meter data, and asset records to spot faults, filter out weather swings, and send the issue straight into a work order flow.
That’s what this article gets across: faster detection, cleaner routing, and tighter follow-up can mean less downtime, lower service waste, and stronger portfolio returns.
Hidden performance problems in solar operations
What normal production output looks like
When an alert goes off, the first job is simple: figure out whether something is actually wrong.
That’s harder than it sounds. Normal production isn’t a single kWh target. It’s a modeled range that shifts based on system size, irradiance, weather, and the expected performance ratio. Without that baseline, a weather-driven dip can look almost the same as equipment underperformance.
Issues that often go undetected without alerts
The most expensive faults are often the quiet ones.
A site that goes fully offline is usually obvious. The problems that slip through are the smaller, quieter ones:
- One string underperforming after a connector issue
- A breaker that trips and resets off and on
- Soiling that builds up little by little over several weeks
- Telemetry loss that stops a site from reporting at all
Telemetry loss is one of the worst cases because it can hide the fault completely. Stale readings can make a site look healthy even when it’s offline.
Why delayed detection raises costs
Every hour of delay costs money.
Lost kWh is the direct hit, but it’s not the only one. For portfolios operating under power purchase agreements (PPAs) or performance guarantees, missed production can also create penalty risk under PPAs or performance guarantees.
Delay also pushes labor costs higher. A string issue found early might be fixed remotely or handled during a short scheduled visit. Leave that same issue alone, and it can grow into a bigger failure that needs an unplanned site visit and more time in the field.
These are the kinds of anomalies real-time alerting is meant to catch before they snowball.
Why real-time alerts belong in a solar ERP
What counts as a real-time anomaly
Not every production dip should set off alarms. The point is to spot problems that are big enough and last long enough to need action.
In practice, a real-time anomaly usually fits into one of five buckets:
- Output below forecast: AC or DC power runs 10%–20% below a weather-adjusted forecast for a sustained period.
- Inverter or string sudden drops: Power drops 30%–50% all at once, and irradiance data doesn’t explain it.
- Voltage or current outside design limits: Phase voltage or string voltage moves outside design bands, or current imbalance between strings goes past 10%–15%.
- High temperature readings: Module backsheet, inverter heat sink, or combiner box temperatures move above safe operating thresholds, such as 149°F–158°F, or show a sharp jump above ambient.
- Telemetry loss: No telemetry comes in from a critical device for 5–15 minutes.
Thresholds should be tuned by asset class, climate, and SLA. A commercial site with a performance guarantee usually needs tighter limits than a site with less contract risk.
Once the system knows what to flag, speed becomes the next issue.
How alerts outperform passive dashboards
A dashboard shows what’s going on. An alert says something needs attention right now.
That gap gets bigger as a portfolio grows. If a team manages dozens or hundreds of sites, no one is going to stare at every screen all day. Issues can sit there until a customer calls or a scheduled report brings them to light. By then, the production loss has already happened.
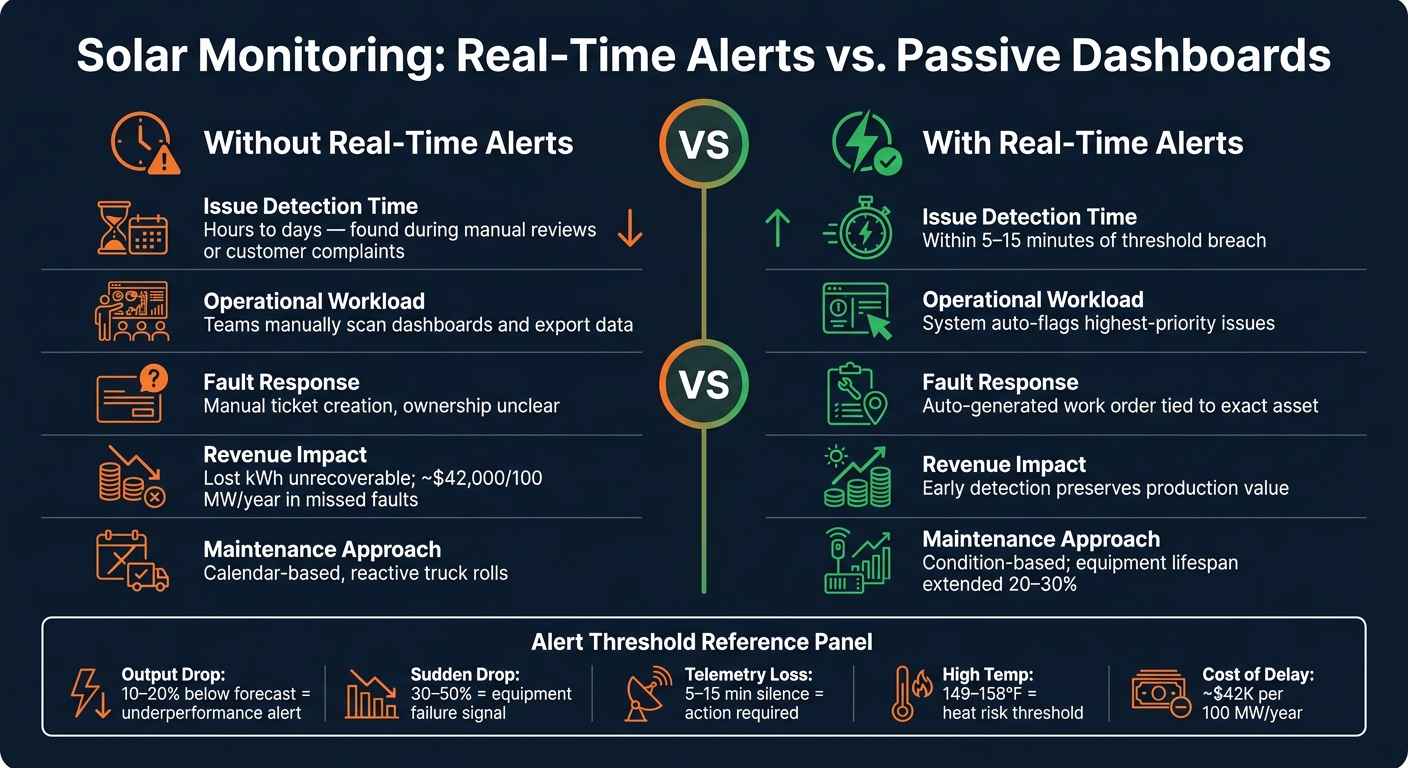
| Aspect | Without Real-Time Alerts | With Real-Time Alerts |
|---|---|---|
| Issue detection time | Hours to days, often found during manual reviews or customer complaints | Minutes after a threshold breach, often within 5–15 minutes |
| Operational workload | Teams manually scan dashboards and export data to find problems | The system flags the highest-priority issues automatically |
Why ERP integration changes the response process
An alert only helps if it lands in the right work queue fast.
When alerts sit in a separate monitoring tool, the process is manual. Someone has to notice the alert, figure out who owns the site, and then create a ticket or work order. That sounds simple, but under heavy volume, it’s easy for steps to drag or get missed.
Putting alerts inside a solar ERP closes that gap. When an anomaly crosses a threshold, the system can automatically create a work order, tie it to the exact inverter, string, or meter, attach telemetry snapshots and past performance data, and send it to the right technician or crew based on skills, certifications, region, and current workload.
Blu Banyan‘s SolarSuccess on NetSuite can connect alerts with assets, work orders, and service history in one system. When an alert fires, the team can see estimated energy loss to date, projected loss per hour, the site’s service history, and the open work order without leaving the ERP. That shared view cuts down the time between alert and dispatch.
How to design effective anomaly detection and alerting
Once alerts land inside the ERP, the next job is simple to say but hard to get right: make them accurate enough to trust and fast enough to use.
Use the right data sources and detection logic
Start with four inputs: device telemetry, revenue-grade meters, weather and irradiance data, and ERP asset master data. Each one gives the system a piece of the story. Put them together, and the ERP can tell the difference between a real fault and normal weather-driven swings. That matters because the goal isn’t just spotting odd behavior. It’s spotting actual revenue loss instead of normal operating variation.
Then stack the detection logic in layers. Different issues show up in different ways, so one rule type won’t cut it.
- Use static thresholds for obvious failures.
- Use expected-vs-actual models to spot weather-adjusted underperformance.
- Use peer-site comparisons to catch unit-to-unit drift.
- Use trend rules to find slow degradation over time.
Set alert categories, severity levels, and timing rules
After you define what counts as an anomaly, the next step is deciding how the system should label it and when it should escalate.
Group alerts by type and severity so the team can move fast. A practical core setup includes production loss, condition, and communication alerts, plus a separate safety class for arc-fault or overheating events. On top of that, add warning, major, and critical severity levels so people know what needs attention first.
| Category | Typical Trigger | Severity | Response Action |
|---|---|---|---|
| Production Loss | Inverter failure or zero-output event | Critical | Auto-create corrective work order; dispatch technician immediately |
| Condition | Overtemperature or gradual degradation | Warning to Critical | Schedule inspection or cleaning; validate against peer site data |
| Communication | Data logger offline or telemetry gap | Warning | Remote gateway reset; escalate to service ticket if unresolved |
| Safety | Arc fault or junction box overheating | Critical | Immediate shutdown; on-site safety inspection |
Timing rules matter just as much as the category. If a production alert fires only after 10–15 continuous minutes of anomaly, the system can ignore single-sample glitches and passing clouds. That one rule alone can cut a lot of noise.
Daylight filters help too. Use sunrise and sunset windows, or an irradiance threshold of 200–300 W/m², so alerts fire only when production should be happening. Planned outage windows also need to be part of the setup. If utility maintenance or scheduled EMS tests are entered in the ERP calendar and tied to each asset, the system can suppress or downgrade those alerts on its own instead of flooding the team with noise.
Connect alerts to tickets, labor, and documentation
Detection only matters when it leads to the next step in the workflow.
The ERP should send each alert into a ticket, asset record, and labor workflow automatically. The point isn’t just to flag anomalies. It’s to turn them into assigned work, with the right context attached from the start.
Blu Banyan’s SolarSuccess on NetSuite can connect alerts, work orders, chat, documents, and labor tracking in one record.
Operational and financial outcomes of faster alerts
The KPIs that alerts directly improve
When alerts are set up well and sent to the right people, you can see the payoff in both ops and finance. Faster detection doesn’t just feel better. It shows up in the numbers by cutting the time between a fault and the response.
| KPI | How Alerts Affect It | ERP Data Sources Used to Track It |
|---|---|---|
| System Availability | Flags inverter trips and outages in real time, cutting long periods of downtime | SCADA/monitoring integration, asset status logs |
| Energy Yield (kWh) | Spots soiling, string drops, and hidden losses before they stack up | Revenue-grade meters, modeled vs. actual production reports |
| Mean Time to Repair (MTTR) | Cuts the detection phase so dispatch and repair can start sooner | Work order timestamps, field service logs |
| O&M Cost per kW | Moves maintenance from calendar-based to condition-based, cutting unnecessary truck rolls | Labor hours (bluTime), parts/inventory records, vendor bills |
| Response Time (MTTA) | Cuts alarm noise so operators acknowledge critical faults faster | Alert timestamps vs. work order creation time |
| Project Profitability | Spots performance deviations before they chip away at monthly revenue | Revenue records, O&M expense tracking, budget variance reports |
These KPIs should be tracked at the portfolio, site, and device levels. That way, teams can see whether a problem is isolated to one asset or showing up across the fleet.
How early detection protects revenue and maintenance budgets
Early detection does more than speed up response. It changes the math of maintenance.
If an inverter fails and nobody sees it, that lost production is gone for good. There is no catch-up later. Finding that failure fast helps preserve production value that would otherwise vanish from the monthly revenue report.
Real-time alerts also move spending away from routine checks and toward repairs that matter. They can extend equipment lifespan by 20% to 30%, pushing labor and parts toward actual faults instead of scheduled inspections that turn up nothing. Poorly tuned alert systems can cost about $42,000 per 100 MW per year in missed faults and delayed response. Deadbands and alarm rationalization help tighten alert logic, and that has a direct effect on the bottom line.
Conclusion: Real-time alerts turn monitoring into action
Undetected anomalies create losses that don’t need to happen. The gap between the start of a fault and the moment someone acts is where revenue slips away and maintenance costs start to pile up. Real-time alerts close that gap, and ERP integration helps make sure the response is fast, documented, and tied to clear ownership.
Better alert design matters. The right detection logic, clear severity levels, and direct links to work orders and labor tracking are what separate a monitoring system that only reports data from one that drives results. Blu Banyan’s SolarSuccess brings those pieces together in one ERP environment, so alerts can trigger the next step automatically.
FAQs
How do I set the right alert thresholds?
Start by assessing your infrastructure and focusing first on the parts that have the biggest impact on day-to-day operations. Then look at historical records and weekly performance reviews to set a clear baseline for what normal system behavior looks like.
For metrics like the Performance Ratio, aim for 85% or higher. If it drops below 60%, that often points to critical failures.
To keep your data clean, use automated validation tools such as Z-score or IQR detection to filter out unrealistic data points.
What data is needed for real-time solar alerts?
Effective real-time solar alerts depend on your cloud ERP connecting with field monitoring systems, IoT sensors, and SCADA data.
That connection gives teams one place to watch what’s happening in the field and tie it back to project work, service history, and revenue.
The data usually falls into three main buckets:
- Operational metrics: voltage, current, irradiance, power output, temperature, and inverter performance
- Asset health data: vibration, pressure, and maintenance logs
- Project tracking and financial data: milestone completions, labor hours, budget variances, Bill of Materials costs, and energy revenue per kWh
If one inverter starts underperforming or site temperature spikes, those signals shouldn’t sit in a silo. Your ERP should pull them in, connect them to the right asset or project, and help your team act fast.
How do ERP-connected alerts reduce downtime?
ERP-connected alerts cut downtime by turning odd performance signals into immediate action before they snowball into bigger failures.
Here’s how it works: when sensor data like voltage, temperature, or inverter performance goes past set thresholds, the ERP can automatically create work orders or send notifications.
That means maintenance teams can step in in hours instead of days. And with AI-driven prioritization, the most urgent alerts rise to the top first, so technicians can focus on the issues that hit energy production the hardest.