

Solar inventory can tie up cash for 60 to 120 days before you get paid. If I want better cash flow, I need to keep high-cost stock low, buy closer to install dates, and move old material out fast.
Here’s the short version:
- Inventory hits cash first. Modules, inverters, batteries, racking, and BOS parts are often paid for long before billing.
- DIO matters most. When inventory sits too long, cash stays stuck. A common target is under 21 days, and trouble often starts above 45 days.
- Forecast from the pipeline. I should buy from booked jobs, install dates, permit status, and conversion rates, not past averages alone.
- Treat parts differently. High-cost items like modules and batteries need tighter control than low-cost consumables.
- Match buying to billing. Supplier terms, release orders, and delivery dates should stay close to customer deposits and milestone payments.
- Bad warehouse control costs cash. Wrong counts, duplicate buys, damaged stock, and rush freight can add 20% to 30% to material cost.
- Old stock needs a deadline. At 90+ days, inventory should be assigned, returned, sold, or written down.
- Track a few numbers every week. DIO, turnover, stockouts, write-offs, aging stock, and committed vs. uncommitted inventory show where cash is getting stuck.
- ERP only helps if it tracks jobs and inventory together. On-hand, committed, available stock, landed cost, and job allocation need to live in one place.
If I had to sum up the article in one line, it would be this: lower solar inventory means less cash trapped on the shelf and more cash available for payroll, new jobs, and margin protection.
The rest of the article explains how to forecast demand, set reorder points, control warehouse use, recover cash from excess stock, and use ERP data to keep inventory from hurting cash flow.
Forecasting Demand and Planning Procurement Around Cash
Use Pipeline, Seasonality, and Policy Signals to Forecast Demand
Forecast inventory from your project management pipeline, not from historical averages alone. A rolling project forecast turns booked jobs and conversion rates into a month-by-month bill of materials for modules, inverters, batteries, and racking. That matters because better forecasting can lower DIO by keeping purchases closer to install dates.
Pull data from CRM stage, contract date, project start date, interconnection status, permit status, and confirmed install date. Then split the forecast into committed, likely, and uncommitted buckets. For near-term purchasing, stick to the first two.
In U.S. residential solar, spring is usually the busiest season. April and May are often the highest-demand months, while winter is the slowest. Policy deadlines can shift demand too. Tax credit or incentive cutoffs often pull installs into Q4, especially November and December, which can squeeze procurement into a short period. If you see those spikes coming, you can buy ahead of the rush without locking up cash too early.
Set Safety Stock, Reorder Points, and Inventory Classes by Cash Impact
Not every part should get the same cash buffer. ABC/XYZ segmentation is a simple way to match safety stock to cash impact. A-items – modules and batteries – usually carry the most value and the most cash risk. B-items like inverters and racking fall in the middle. C-items, such as connectors, conduit, and fasteners, are low-cost and fast-moving.
| Inventory Class | Typical Items | Lead Time | Recommended Approach |
|---|---|---|---|
| A-Items | Modules, batteries | Often longest; modules commonly run 8–12 weeks | JIT or near-JIT; pipeline-based ordering; high visibility |
| B-Items | Inverters, racking | Moderate and variable; some inverters run 5–10 weeks | Safety stock tied to lead-time variability; volume-discount focus |
| C-Items | Connectors, conduit, fasteners | Short | Higher buffers acceptable; automated min/max reorder |
Within each class, safety stock should reflect lead-time variability, supplier reliability, and available working capital. Not a blanket “two weeks of everything” rule. Use this formula:
Safety Stock = (Max Daily Usage × Max Lead Time) − (Avg Daily Usage × Avg Lead Time)
From there, set reorder points with:
Reorder Point = Average Daily Usage × Lead Time (days) + Safety Stock [1][5]
Lower inventory means less cash tied up upfront. And the difference between parts matters. A battery order waiting on utility approval should not be treated the same way as a common connector you can restock in a hurry.
Those limits only help if the warehouse knows what is on hand, what is aging, and what is already assigned to a job.
Choose Procurement Terms That Match Project Billing
Inventory payments should trail customer billing by a small margin whenever possible. If a project brings in a deposit at contract signing and a milestone payment at equipment delivery, staged purchasing tied to those events helps keep cash outflows from getting too far ahead of inflows. When purchasing moves faster than billing, cash gets stuck. Align supplier terms, release orders, and delivery timing with customer payments.
Use net terms, smaller release orders, and delivery dates that line up with installation. Buying everything upfront for a job that is still waiting on utility interconnection approval is one of the fastest ways to tie up cash.
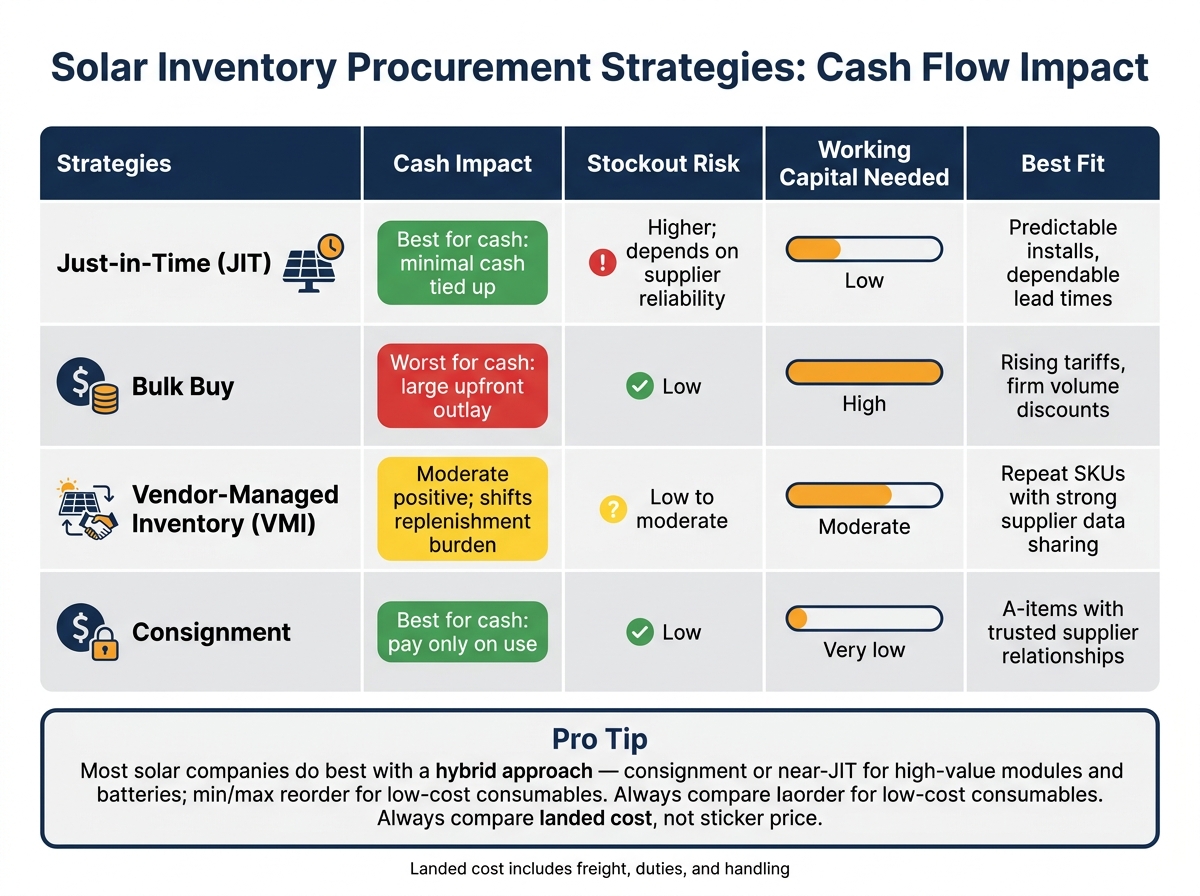
The right purchasing model depends on the item and the timing of the project. Here’s how the main options stack up for cash:
| Strategy | Cash Impact | Stockout Risk | Working Capital Needed | Best Fit |
|---|---|---|---|---|
| Just-in-Time (JIT) | Best for cash: minimal cash tied up | Higher; depends on supplier reliability | Low | Predictable installs, dependable lead times |
| Bulk Buy | Worst for cash: large upfront outlay | Low | High | Rising tariffs, firm volume discounts |
| Vendor-Managed Inventory (VMI) | Moderate positive; shifts replenishment burden | Low to moderate | Moderate | Repeat SKUs with strong supplier data sharing |
| Consignment | Best for cash: pay only on use | Low | Very low | A-items with trusted supplier relationships |
Most solar companies do best with a hybrid approach. Use consignment or near-JIT for high-value A-items like modules and batteries. Use simple min/max reorder rules for C-items. Bulk buying can make sense when tariff increases are confirmed or when a vendor discount clearly beats carrying costs. But do the math first. Include landed cost – freight, duties, and handling – not just unit price. Always compare landed cost, not sticker price.
Once buying timing is lined up, warehouse controls help keep that cash tied to the right job.
Warehouse, Storage, and Job Allocation Controls That Protect Cash
Improve Receiving, Counting, and Aging Visibility
Warehouse mistakes can lock up cash fast. In many cases, the leak starts right at the receiving dock. If inventory records are off from day one, teams end up making emergency buys, placing duplicate orders, and taking write-offs later.
A simple fix is a three-way match: purchase order, packing list, and physical count before anything is entered into stock. If there are shortages, overages, or damaged materials, record them on the spot and quarantine them. That keeps on-hand balances clean. For high-value items, capture serial numbers so you don’t end up with phantom inventory or duplicate purchases.
After receiving is under control, cycle counts help keep records from drifting over time. The goal is 95–98% accuracy for Class A items like modules, inverters, and batteries, with monthly counts. Class B items, such as racking, should be counted quarterly at 92–95% accuracy. Class C consumables can be counted annually at 85–90% accuracy. When cycle counts are weak, the result is familiar: stockouts, bloated safety stock, and rush purchases. And those rush buys usually cost 20%–30% more than planned orders.
Any item older than 90 days should trigger action. Commit it to a job, return it, or write it down. Aging inventory works best when it’s grouped as committed, redeployable, returnable, or obsolete. When that aging data is tied to the project forecast, it’s much easier to act before old stock turns into a bigger cash drain.
That kind of visibility only lasts if parts are stored and tracked the same way every single time.
Reduce Damage and Misuse With Storage and Traceability Controls
Damaged inventory is money you won’t get back. Panels need protection from impact, moisture, and bad stacking. Batteries need controlled temperature, protected terminals, and careful handling. For both, the recommended storage environment is dry and ventilated, with temperatures between 59°F and 77°F (15–25°C) and humidity below 90%. Designated staging areas at yards and job sites also help keep materials protected and separated.
Traceability matters here too. QR labels, serial numbers, and lot tracking help cut mistakes, speed up counts, and make warranty claims less painful. QR-based systems can reduce inventory errors from about 25% to under 5% and cut count time by 60%–70%.
Allocate Inventory to Jobs to Support Billing and Margin Control
Every material should be assigned to a job when it leaves inventory, not weeks later at closeout. That way, cost and usage update in real time. If a job burns through more material than planned, the overrun shows up fast. That’s the whole point. You want to see the problem while there’s still time to do something about it.
When overruns stay hidden until billing, the damage is usually already done. In most cases, that happens because materials were never recorded by job in the first place. By the time the invoice goes out, the margin loss is already baked in.
Here’s the difference between weak and strong controls:
| Control Area | Weak Controls | Strong Controls |
|---|---|---|
| Inventory Accuracy | Manual tracking; frequent phantom stock and double-buying | Live dashboards; scan-based receiving and inventory software; reliable on-hand balances |
| Shrinkage | Materials move between warehouse, yard, and site with no recorded transaction | Every transfer logged; lot and serial tracking for high-value items |
| Aging Stock | No review cadence; dead stock accumulates unnoticed | 90-day aging flags; pipeline-linked redeployment or return decisions |
| Cash Tied Up | Excess buffer stock and high carrying costs | Lower on-hand levels and demand-linked purchasing |
When records are clean, it’s much easier to spot excess and obsolete stock and move on it fast, whether that means returns or liquidation. And once job-level tracking is in place, the focus shifts to pulling cash back out of excess, obsolete, and returnable inventory.
Recover Cash From Returns, Excess Stock, and Better Reporting
Once inventory is tied to jobs, the next step is simple: get cash back from anything that no longer belongs in the pipeline.
Build a Process for Excess, Obsolete, and Dead Stock
Excess stock is more than the next 3–6 months of demand. Obsolete stock no longer fits current designs or interconnection rules. Dead stock has had no movement for 180+ days.
Don’t wait until material has been sitting forever. When items reach the 91–180 day range, trigger a review. At 181–270 days, move into clearance action. At 271+ days, make a liquidation or disposal call.
Start with the items holding the most cash. Rank flagged inventory by on-hand value, highest first. That gives you a clear view of where money is stuck.
For current modules and inverters, return-to-vendor should be the first move if return windows are still open and restocking fees are capped. If a return isn’t possible, the next options are straightforward:
- Sell through secondary channels
- Redeploy compatible racking and BOS parts to other jobs
- Dispose of what’s left under recycling rules
Scrap is the last resort for a reason. It usually brings back only 2%–5% of cost.
Use these cutoffs to decide what to do first, then track whether those actions are bringing total inventory value down.
Track the KPIs That Show Whether Inventory Is Helping or Hurting Cash Flow
Start with inventory turnover and DIO.
Turnover = COGS ÷ average inventory.
DIO = 365 ÷ turnover.
If DIO starts climbing for modules or inverters, especially past your usual project lead time, cash is getting trapped. A turnover rate below 3 for standard materials or storage days above 90 for high-value components is a plain warning sign.
Then look at the next layer of metrics. Write-off rate – value written off ÷ total inventory value × 100 – shows how much bad stock is costing each period. Stockout rate above 2–5% points to the opposite issue: inventory is too lean in the wrong spots. And project-level margin versus budget, pulled from ERP job records, shows whether material choices are protecting profit or eating into it.
Your reporting cadence matters too. Weekly dashboards should flag stockouts, expedite freight, rush buys, and aging alerts. Monthly dashboards should show turnover, days on hand, inventory value, write-offs, working capital tied up in inventory, and CCC.
There’s a clear payoff here. Targeted inventory optimization work has cut inventory days by 11–25% in documented cases, freeing up working capital without hurting availability.
Push the same metrics into ERP reports so slow stock doesn’t disappear from view again.
Use Comparison Tables to Guide Recovery Decisions
When a flagged item needs a disposition decision, don’t rely on gut feel. A side-by-side comparison makes the choice faster and more consistent.
| Disposition Option | Typical Cash Recovered | Time to Recovery | Best Fit |
|---|---|---|---|
| Return to vendor | 80–100% of cost (net of restocking fees) | 2–6 weeks | Current modules, inverters with valid return terms |
| Discount sale | 50–80% of cost | Variable (weeks to months) | Items with secondary market demand; older but functional stock |
| Internal redeployment | 100% of cost basis (used on a job) | Tied to project schedule | Racking, BOS components compatible with upcoming jobs |
| Disposal / scrap | 2–5% of cost | Fast, but minimal recovery | Truly obsolete items with no viable alternative path |
Put this table into SOPs and ERP so teams make the same call each time. ERP should surface return eligibility, aging, and fees in one view.
Set Up ERP and Inventory Systems to Support Better Cash Use
ERP Capabilities That Matter for Solar Inventory Cash Control
Once your inventory rules are in place, the ERP system is what keeps them accurate across every warehouse, van, and job site. For mid-to-large solar installers, that means tighter control over stock, jobs, and cash in one system. You need to track on-hand, committed, and available inventory by location in U.S. dollars so one branch doesn’t keep buying while another is sitting on extra stock.
Lot and serial tracking helps you manage panels, inverters, and batteries by serial number or lot. That matters for warranty claims, recall management, and aging analysis down to the unit level. Dynamic reorder points and safety stock targets should update based on signed contracts, confirmed start dates, and pipeline stage changes, so purchasing stays closer to actual demand instead of guesswork.
It also helps to use landed-cost tracking. That way, job margins include freight, duties, and handling instead of leaving those costs buried somewhere else. And when CRM, projects, procurement, inventory, and accounting are connected, a signed contract can move into a BOM, a requisition, a receipt, and a billed job without manual handoffs.
That same setup also leads to cleaner job costing and faster billing.
Where Blu Banyan Fits in a Cash-Focused Solar ERP Strategy
A solar-specific ERP works best when all of these controls live inside one workflow.
Blu Banyan’s SolarSuccess on NetSuite brings together accounting, CRM, project management, inventory, and cash reporting. Its SuiteApps help fix workflow gaps that hurt inventory accuracy.
- bluDocs attaches documents to purchasing and warranty records
- bluChat keeps teams working inside NetSuite records
- bluConnect syncs outside systems with BOM and inventory data
- bluTime adds labor cost visibility to job margins
Together, these tools help cut inventory lockup, avoid missed billing milestones, and reduce margin leakage across each job.
Conclusion: The Inventory Changes That Free Up Cash Fastest
These ERP controls make inventory cash discipline repeatable. Just as important, the same system should show whether those controls are helping cash flow.
| Cash Flow KPI | What It Measures | ERP Features Required |
|---|---|---|
| Days inventory outstanding (DIO) | How long cash sits in stock before materials are used | Multi-location tracking, aging reports, accurate item costing |
| Inventory turnover | How well inventory turns into project revenue | COGS integration, item classification, location-level dashboards |
| Write-offs and markdowns % | Cash lost to damage, obsolescence, and overbuying | Adjustment tracking, disposition codes, approval workflows |
| Committed vs. uncommitted inventory | How much stock is reserved for jobs vs. available to redeploy or sell | Job-level allocation, project BOM integration, reservation dashboards |
| Cash tied up in excess or obsolete stock | Working capital trapped in slow-moving or dead inventory | Aging buckets by item class, slow-mover alerts, disposition tracking |
FAQs
How can I lower DIO without causing stockouts?
Lower DIO by shifting from reactive inventory management to a predictive approach built on real-time data. A centralized ERP can line up purchasing with project milestones, so materials show up when they’re needed instead of sitting on shelves.
You can also use automated demand planning that looks at past usage, seasonal patterns, and your project pipeline. Then track inventory turnover and SKU-level performance to keep fast-moving items in stock, cut surplus, and avoid last-minute purchases.
Which solar materials should I keep in stock vs. buy just in time?
It comes down to balancing project timelines with cash flow.
If you keep too much inventory on hand, you tie up cash in storage and insurance. You also take on more risk that parts will become obsolete as solar tech keeps changing.
For most components, it makes sense to lean toward just-in-time purchasing. That helps cut carrying costs and keeps inventory lean. Use SolarSuccess to sync your bill of materials with sales orders, so you buy only what you need, when you need it.
What ERP data matters most for inventory cash flow?
The most important ERP data for inventory cash flow is real-time stock position: what you have, where it is, and what state it’s in. That includes stock on hand, items in transit, and materials sitting at project sites.
You’ll also want to track the demand and purchasing data tied to the BOM. In plain terms, that means keeping a close eye on:
- Current inventory
- Open purchase orders
- Supplier pricing and lead times
- Forecasted material needs
- Inventory aging and turnover/DSI
If stock position tells you what’s sitting where, these inputs show what’s about to move, what it will cost, and where cash can get stuck.
