

If your teams use different definitions, your KPI dashboard will show different answers. In solar, that often hits sales, installs, margin, cash, and backlog first.
I’d boil this down to a simple fix: define each KPI once, tie it to one NetSuite source, assign one owner, and review it on a set schedule. The article also points to common weak spots – like mismatched milestone rules, project costs not tied to POs, and post-install costs missing from job records – that can skew reports and slow billing.
Here’s the full picture in plain terms:
- Lock KPI definitions first
- Terms like Booked Jobs, Install Complete, and Days to PTO need one shared meaning.
- Assign ownership
- Each KPI should have one person who answers for it.
- Map every KPI to NetSuite
- Use records like Opportunities, Sales Orders, Projects, Item Fulfillments, Vendor Bills, Invoices, and Customer Payments.
- Build dashboards by role
- A CFO needs margin, DSO, cash, and backlog.
- A COO needs install speed and completion.
- A Sales Leader needs bookings, close rate, and revenue vs. target.
- Use a fixed review rhythm
- Daily for field progress
- Weekly for sales and install flow
- Monthly for margin, AR, cash, and backlog
- Fix data gaps early
- One bad milestone rule or missing project cost can throw off reports by days or even weeks.
A few numbers stand out from the article: it centers on 12 KPIs, grouped into 5 areas, with review cycles split across daily, weekly, and monthly use. It also cites one case where separate systems created manual work and mismatched data until the company moved to a NetSuite-based setup.
If you want NetSuite KPI tracking to work, the goal is simple: one definition, one source, one owner, one review cadence for each metric. The rest of the article shows how to set that up without turning reporting into a spreadsheet cleanup job.
2. Define Your Solar KPI Set and Assign Ownership
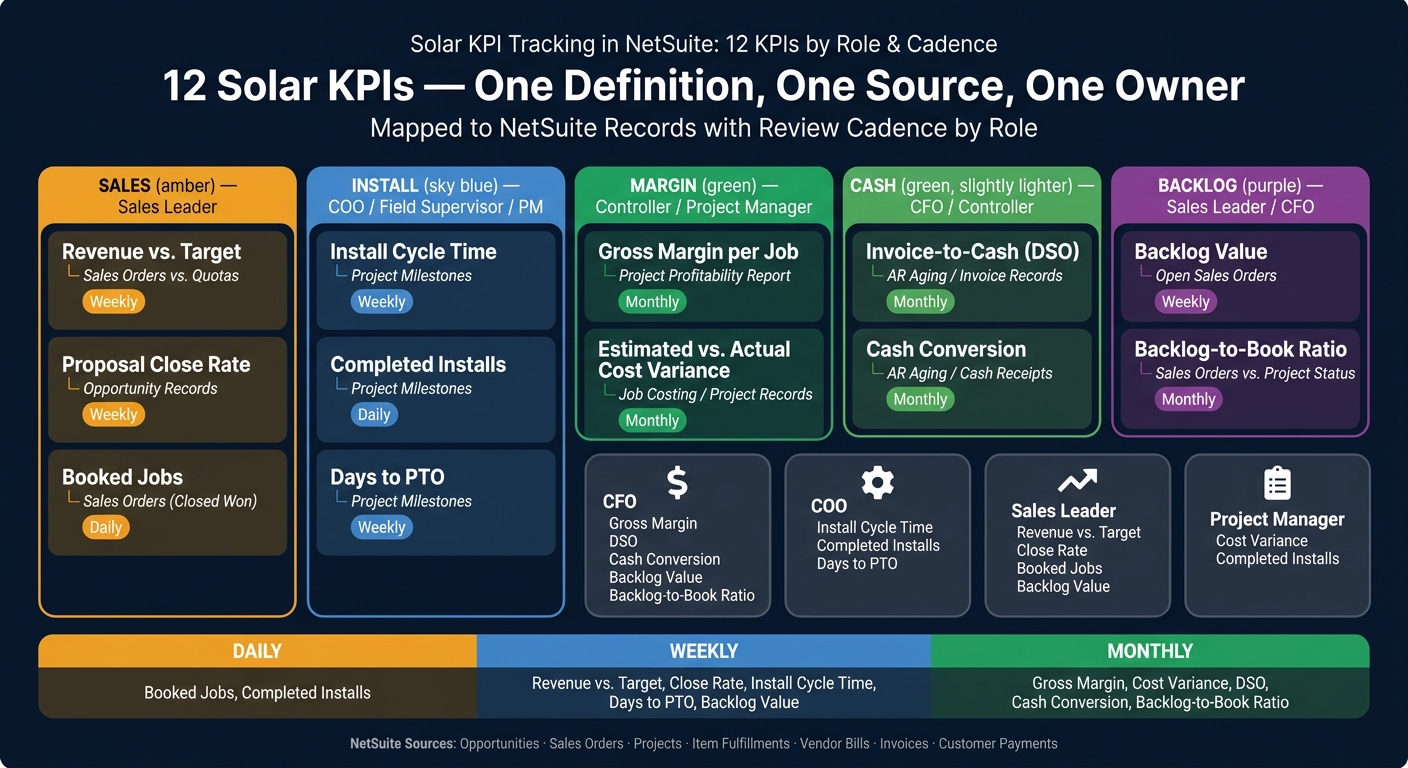
Define each KPI before you build reports. That means agreeing on one clear meaning for terms like booked jobs, install complete, and every other milestone your team uses. Then assign one owner and one review cadence to each metric. Do this first, before dashboards or saved searches enter the picture.
The five KPI groups – sales, install, margin, cash, and backlog – each need one definition, one owner, and one review cadence. Keep it simple: one owner per KPI, so when variance comes up, one person is accountable for the answer.
Sales and install KPIs
Sales KPIs show pipeline health and conversion. Revenue vs. Target compares actual sales with set quotas. Proposal Close Rate measures the share of opportunities that turn into signed jobs. Booked Jobs tracks the total value of signed contracts in a given period.
Install KPIs focus on timing and completion. Install Cycle Time measures the number of days from contract execution to PTO. Completed Installs counts jobs that have reached the “Install Complete” milestone in NetSuite. Days to PTO tracks how long utility approval takes after installation is done.
Margin, cash, and backlog KPIs
Margin KPIs are finance-focused. Gross Margin per Job equals revenue minus actual labor and material cost. Estimated vs. Actual Cost Variance compares the original budget with what the job actually cost. Both are usually reviewed during the monthly close.
Cash management and backlog KPIs tie ops to finance. Invoice-to-Cash (DSO) measures how long collection takes after billing. Cash Conversion tracks how fast project spend comes back as cash. Backlog Value is the dollar value of sold work that has not been installed yet. Backlog-to-Book Ratio compares new bookings with backlog depletion.
Once your KPI set is locked in, map every metric to a NetSuite source. The 12 KPIs below should each have a source, cadence, and owner:
| KPI Name | What It Measures | NetSuite Source | Review Cadence | Owner |
|---|---|---|---|---|
| Revenue vs. Target | Actual sales vs. set quotas | Sales Orders vs. Quotas | Weekly | Sales Leader |
| Proposal Close Rate | Share of opportunities that close as signed jobs | Opportunity Records | Weekly | Sales Leader |
| Booked Jobs | Total value of signed contracts | Sales Orders (Status: Closed Won) | Daily | Sales Leader |
| Install Cycle Time | Days from contract execution to PTO | Project Milestones | Weekly | COO / PM |
| Completed Installs | Jobs reaching “Install Complete” milestone | Project Milestones | Daily | Field Supervisor |
| Days to PTO | Time from install completion to utility approval | Project Milestones | Weekly | Project Manager |
| Gross Margin per Job | Revenue minus actual labor and material cost | Project Profitability Report | Monthly | Controller |
| Estimated vs. Actual Cost Variance | Variance between budget and actual spend | Job Costing / Project Records | Monthly | Project Manager |
| Invoice-to-Cash (DSO) | Average time to collect after billing | AR Aging / Invoice Records | Monthly | CFO / Controller |
| Cash Conversion | Speed of recovering project spend in cash | AR Aging / Cash Receipts | Monthly | CFO |
| Backlog Value | Dollar value of sold work not yet installed | Open Sales Orders | Weekly | Sales Leader / CFO |
| Backlog-to-Book Ratio | New bookings vs. backlog depletion | Sales Orders vs. Project Status | Monthly | CFO |
Next, map each KPI to the NetSuite records and saved searches that power reporting.
3. Map Each KPI to Its NetSuite Data Source
A dashboard is only as good as the NetSuite data behind it. So once you’ve locked in each KPI and assigned an owner, the next move is simple: map every metric to one NetSuite record or one saved search.
That matters because if two teams pull the same KPI from two different places, numbers drift fast. And then the dashboard stops being useful.
Core NetSuite records that feed solar KPI reporting
Opportunities and estimates feed sales pipeline KPIs. Once a deal is won, closed-won sales orders capture the signed contract and become the base for backlog reporting. Sales orders are non-posting transactions, which means they track committed revenue without touching the general ledger until fulfillment or invoicing.
Projects hold milestone dates. Item fulfillments show install completion. Purchase orders and vendor bills track committed and actual cost. Invoices and payments power billing, collections, and DSO.
| Record Type | KPI Group It Feeds |
|---|---|
| Opportunities / Estimates | Sales pipeline, conversion rate |
| Sales Orders | Booked jobs, backlog value |
| Projects / Jobs | Install cycle time, days to PTO, margin |
| Item Fulfillments | Completed installs, install throughput |
| Purchase Orders / Vendor Bills | Job cost actuals, cost variance, gross margin |
| Invoices / Customer Payments | DSO, cash collected, AR aging |
Once each KPI has a clear source, the dashboard can show one version of the truth for each role.
Saved searches and custom KPI logic
NetSuite’s standard KPI metrics handle basic summaries. But many solar KPIs need custom saved searches. That includes gross margin per project, contract-to-install days, and backlog by stage.
When you build saved searches for KPI dashboards, keep the setup tight:
- Use one summary field per search
- Leave date filters out of Criteria
- Expose date fields in Available Filters
- Prefix the search name with “KPI:” so it’s easy to find and manage across dashboards
For backlog searches, use transaction type = Sales Order, mainline = false, tax/shipping lines = false, line closed = false, and a formula that shows ordered quantity minus fulfilled quantity > 0.
Drill-down access matters too. A KPI meter for gross margin is nice, but the real value comes when someone can click the number and see the jobs behind it. That’s what turns a dashboard from a pretty screen into something a team can act on.
Build line-level searches so users can move from the KPI straight to the source records.
These searches become the inputs for role-based dashboard portlets. This structured approach helps companies improve efficiency across the entire installation lifecycle.
4. Build a Role-Based KPI Dashboard in NetSuite
Once each KPI has a clear source, the next move is to turn that data into a dashboard people will want to check. The best way to do that in NetSuite is simple: build one dashboard for each role.
Why? Because not everyone needs the same view. A dashboard that works for a CFO will feel cluttered to a project manager. And a sales leader doesn’t need the same home screen as a COO. So use those data sources to build dashboards by role, not one giant dashboard for everyone.
Set up KPI Portlet, KPI Meter, Trend Graph, and KPI Scorecard
Start by adding the Key Performance Indicators portlet to the dashboard. This gives you a way to pull in both standard NetSuite metrics and the custom saved searches created in the previous step. Then match each KPI to the portlet that makes the most sense.
| Portlet Type | Best Use Case | Solar Example |
|---|---|---|
| KPI Portlet | Summary of multiple KPIs | Total revenue, gross margin, and open leads in one view |
| KPI Meter | Visual gauge for a single headline metric against a target | Monthly install throughput vs. goal |
| Trend Graph | Movement over time | Gross margin per watt over the last 6 months |
| KPI Scorecard | Period or category comparisons | Current month vs. last month for DSO and AR aging |
Here’s the simple way to think about it:
- Use the KPI Portlet when you want a quick summary of several metrics in one place.
- Use the KPI Meter for target-based metrics like install targets, sales quota attainment, or permit approval volume.
- Use the Trend Graph when the direction matters just as much as the current number, like tracking DSO over several weeks.
- Use the KPI Scorecard when side-by-side comparisons matter, such as budget vs. actual costs or recognized vs. billed revenue.
Arrange dashboard views by role and business priority
Once you’ve picked the right portlets, map each dashboard to the KPIs that matter most for that role.
A CFO and a COO should not be staring at the same screen all day. A CFO’s dashboard should lead with gross margin per job, AR aging, cash flow forecasting, DSO, backlog value, and backlog-to-book ratio. A COO’s dashboard should put install cycle time, days to PTO, and completed installs front and center.
That same logic applies across the business. Role-based layouts make it easier for each team lead to see the numbers they own without digging around.
A sales leader will care most about pipeline velocity, proposal close rate, booked jobs, and revenue vs. target. A project manager needs estimated vs. actual cost variance and completed installs. Put the right metrics in front of the right person, and the dashboard becomes a working tool instead of just another screen.
How Blu Banyan supports dashboard design
If your team needs help shaping NetSuite around solar workflows, Blu Banyan can support the dashboard build. Blu Banyan can help configure solar-specific NetSuite dashboards, customizations, and integrations through SolarSuccess and its SuiteApps.
5. Set a Review Cadence and Fix Common Tracking Gaps
Once the dashboard is live, the job shifts from building to using it well. That means giving each team a set review rhythm and fixing the workflow issues that skew the numbers.
Daily, weekly, and monthly reporting cadence
A dashboard only helps if people check it on a fixed schedule. If reviews happen randomly, KPI data gets old fast and decisions slow down.
| Role | Cadence | Primary KPIs |
|---|---|---|
| Project Manager | Daily | Completed Installs, Install Cycle Time, Days to PTO |
| Sales Leader | Weekly | Revenue vs. Target, Proposal Close Rate, Booked Jobs, Backlog Value |
| COO / Ops Leader | Weekly | Install Cycle Time, Completed Installs, Days to PTO |
| Controller | Monthly | Gross Margin per Job, Estimated vs. Actual Cost Variance, Invoice-to-Cash (DSO) |
| CFO / CEO | Monthly | Gross Margin per Job, DSO, Backlog Value, Backlog-to-Book Ratio |
Here’s the simple way to think about it:
- Daily reviews keep field execution on track.
- Weekly reviews help teams spot movement in operations and sales.
- Monthly reviews focus on margin, cash, and backlog.
After that review rhythm is in place, the next step is closing the data gaps that lead to KPI drift.
Common KPI tracking gaps to fix
Even a good dashboard falls apart when project data, procurement, and billing live in separate habits instead of one shared workflow.
One common issue is inconsistent milestone definitions. If “Install Complete” means one thing to field crews and something else to finance, billing slows down and reporting follows it off course. Set one definition for each milestone, and make it clear who signs off. That keeps operating data and accounting records lined up.
Another problem is failing to connect purchase orders to project committed cost. When POs sit outside the project record, committed cost shows up too late in margin reporting. Tying POs to projects fixes that. Costs can appear before the vendor bill lands, which gives teams a much cleaner view of margin.
A third gap shows up when inventory moves and post-install costs never make it onto the project record. Damaged panels, used materials, and warranty replacements should be posted to the project itself, not pushed through as generic adjustments. If not, margin reporting starts to drift, and the Controller sees budget changes later than they should.
Conclusion: A baseline framework for reliable solar KPI tracking
Reliable solar KPI tracking in NetSuite depends on clear definitions, one source of truth for each metric, role-based dashboards, a steady review cadence, and fast fixes for process gaps.
FAQs
Which KPIs should we set up first in NetSuite?
Start with KPIs that help finance and PMs track margin and cash by installation:
- project gross margin % and gross margin per watt
- budget vs. actual and committed costs
- WIP and recognized vs. billed revenue
- labor cost by phase
- installation cycle time, permit cycle time, change-order rate, and DSO
How do we keep KPI definitions consistent across teams?
Centralize operational and financial data in one shared database so CRM, project management, and accounting all pull from the same records. That cuts down on conflicting data sources and manual spreadsheet updates.
Set standard milestone definitions, like what counts as “Install Complete,” and use automated workflows plus validation rules to keep data collection and record updates consistent. Then tie dashboards to that same source of truth.
What data issues usually make solar KPI dashboards unreliable?
Solar KPI dashboards often fall apart when data sits in separate systems instead of one shared source of truth. If your CRM, project management, inventory, and accounting tools all live in their own lanes, teams usually end up leaning on manual spreadsheets. And that’s where things get messy: numbers stop matching, updates lag behind, and trust in the dashboard starts to slip.
Accuracy also takes a hit when reports don’t pull straight from project-linked transactions. The same problem shows up when day-to-day events, like installation milestones or time entries, aren’t connected to the general ledger. Once those links are missing, the dashboard may look polished on the surface, but the numbers underneath can be off.
