
If you run solar projects across many sites, ERP is the system that ties asset records, service work, and finance data together. It gives you one place to track each site, inverter, meter, and panel by ID, serial number, status, warranty, cost, and depreciation.
Here’s the short version:
- I use ERP to build one asset tree: portfolio → site → array/string → equipment
- I keep ownership, warranty, cost, and service history in ERP
- I leave live telemetry, alarms, and performance signals in the monitoring platform
- I connect both systems with asset IDs, timestamps, and status codes
- I turn alarms into work orders, service cases, and cost records
- I roll that data up into site and portfolio views for maintenance and accounting and finance
The point is simple: when a fault hits on 08/10/2026, I don’t just see that an inverter is down. I can also see where it is, when it was installed, whether it is under warranty, what the repair costs, and how the downtime affects revenue.
A few details matter a lot:
- The U.S. solar fleet is at 279.2 GW
- EIA projects 43.4 GW of utility-scale additions in 2026
- Inverter issues drive 51% of corrective maintenance cases and 59% of energy lost
- ERP records should store fields like serial number, model, install date, warranty end date, kWdc, kWac, time zone, COD, and utility data
Quick comparison
| System | What I use it for | Main data |
|---|---|---|
| Monitoring platform | Track production, alarms, and fault signals | Power, runtime, fault codes, telemetry |
| Solar ERP | Track assets, service, contracts, and finance | Asset IDs, warranties, work orders, costs, depreciation |
In plain English, this article shows how solar ERP benefits data management by setting up the data structure, connect monitoring events, route alarms into work, and roll everything into one view for service and finance.
How to Build an Asset Hierarchy for Sites, Inverters, Meters, and Panels
Use one parent-child structure so every asset record has a single home in ERP. Once the asset model is set, the next move is simple: map each physical component to one ERP record.
Map Portfolio, Site, Array, String, and Equipment Relationships
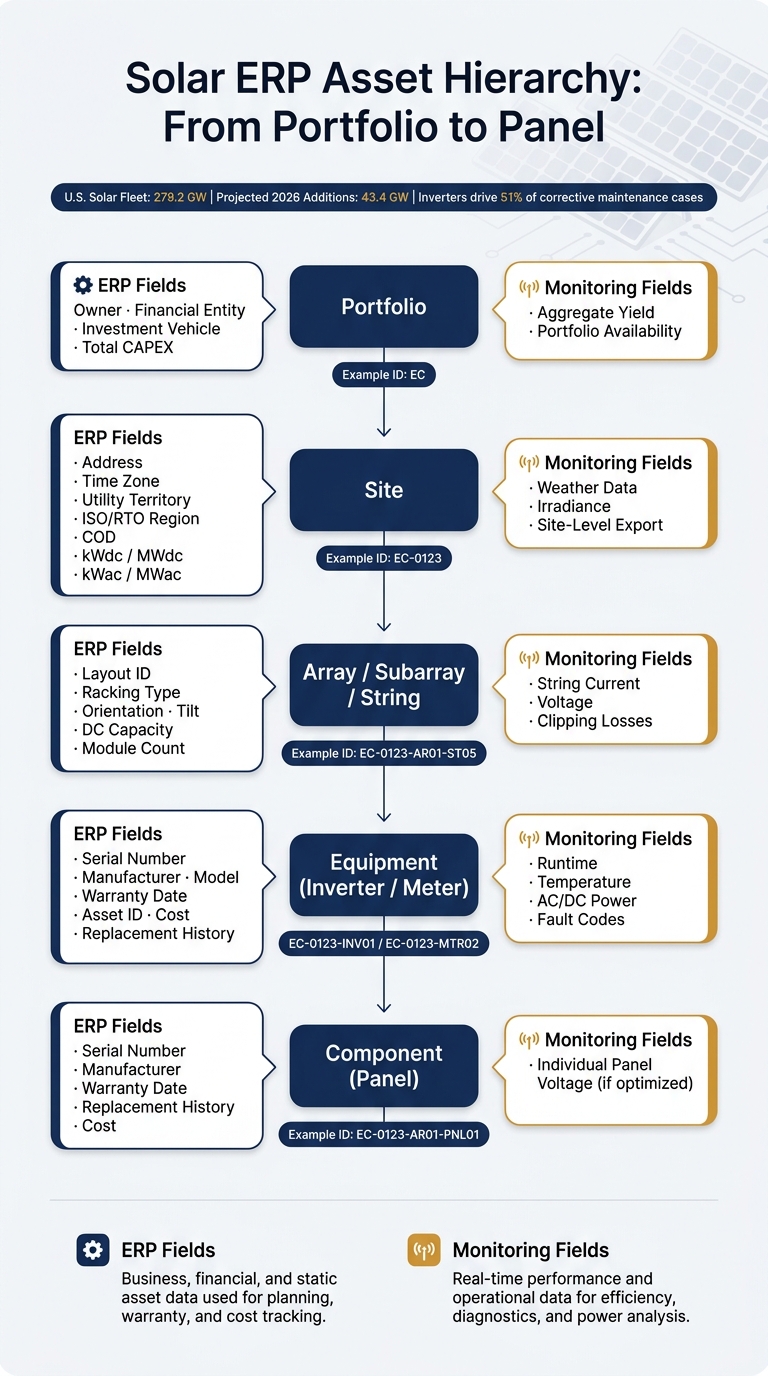
Use a Portfolio → Site → Array/Subarray → String → Equipment hierarchy. That setup helps ERP tie each alarm, cost, and replacement back to the right asset later.
If one site has multiple interconnections or offtakers, keep one master Site record. Then create separate Meter Groups for each revenue meter or point of interconnection. Each Meter Group should store its own contract ID, offtaker, PPA or tariff details, and utility account number, while still linking back to the arrays and inverters that feed it. That way, revenue reporting and operating reporting stay lined up without copying the physical site record.
A good rule of thumb: keep ownership and contract data in ERP, and keep live telemetry in the monitoring system. Here’s how that usually breaks down:
| Hierarchy Level | Typical ERP Fields | Typical Monitoring Fields |
|---|---|---|
| Portfolio | Owner, financial entity, investment vehicle, total CAPEX | Aggregate yield, portfolio availability |
| Site | Address, time zone, utility territory, ISO/RTO region, COD, nameplate capacity (kWdc / MWdc and kWac / MWac) | Weather data, irradiance, site-level export |
| Array / String | Layout ID, racking type, orientation, tilt, DC capacity, module count | String current, voltage, clipping losses |
| Equipment (Inverter / Meter) | Serial number, manufacturer, model, warranty date, replacement history, asset ID, cost | Runtime, temperature, AC/DC power, fault codes |
| Component (Panel) | Serial number, manufacturer, warranty date, replacement history, cost | Individual panel voltage (if optimized) |
Consistent hierarchy is what makes fleet-wide comparisons possible. If one team logs inverters at the site level and another logs them under strings or arrays, reporting gets messy fast.
Set Asset IDs, Serial Numbers, and Site Records
Use one ID format across the portfolio. A structured format like Portfolio Code + Site Code + Hierarchy Level + Sequence keeps records easy to read and sort. For example, a site coded "EC-0123" can extend cleanly: inverters become EC-0123-INV01, meters become EC-0123-MTR02, and strings become EC-0123-AR01-ST05. Put changing details in fields, not in IDs.
For serial numbers, capture them at receiving with barcode scanning when possible, then confirm them in the field during commissioning. ERP should enforce format checks and uniqueness so the same serial number can’t end up on two records. If a component is replaced, close the old record and create a new one for the replacement. Once the IDs are locked in, status updates can sync to the right record without manual cleanup.
For U.S. site records, a few fields are easy to miss and can cause problems later:
- Explicit time zone, stored as
America/Chicagoinstead of just “Central” - County
- ISO/RTO region, such as ERCOT, PJM, or CAISO
- Separate date fields for Mechanical Completion, Initial Energization, and Commercial Operation Date (COD)
- DC nameplate stored separately from AC nameplate: kWdc and kWac
SolarSuccess for NetSuite from Blu Banyan includes pre-built solar-specific record types for portfolios, sites, equipment, and service records. So teams can configure around an existing solar data model instead of building custom record types from scratch. It also supports multi-meter site setups and standardized capacity and date fields, which helps teams keep hierarchy design consistent across hundreds of U.S. projects.
How to Connect Status Updates and Monitoring Events to ERP Workflows
The next step is keeping asset records up to date. Use the asset IDs and site records set up earlier so monitoring events stay tied to the correct asset.
Sync Online, Offline, Faulted, and Maintenance Statuses
Monitoring data can flow into ERP through a REST API, scheduled CSV/XML imports, or a connector with preset mappings and error handling. No matter which route you use, each event should include the asset ID, UTC timestamp, status code, source system, and site ID.
Every status change should be stored as a new history row, not written over the old one. That gives you a clean timeline of what happened and when. It also helps to make ERP fields updated by integrations read-only for standard users, which helps protect the record.
Before you write a status change, apply threshold logic. For example, ignore zero output that lasts less than 5 minutes. Only trigger an offline status after 15 minutes or more. On the recovery side, use hysteresis too. In plain English: don’t clear a fault the second readings look normal again. Require 10–15 straight minutes of normal readings before the system resets the status.
Scheduled maintenance needs its own path. If work is planned, route alarms to maintenance status instead of logging faults. And to stop duplicate records during retries, assign a unique idempotency key to every event payload.
Turn Alarms into Work Orders, Service Cases, and Cost Records
When a status crosses a set threshold, the ERP should act on its own instead of waiting for someone to spot the issue. If an inverter faults, the system should open a corrective work order already filled in with the asset model, serial number, site details, fault code, and a telemetry snapshot from the moment the event occurred. If a meter shows a 5%–10% variance from modeled yield, open a meter investigation case and flag the affected revenue accrual period.
After the case is closed, capture the cost and downtime details finance needs:
- Technician name
- Labor hours and rate
- Parts used with unit costs
- Travel distance in miles
- Total downtime in hours
In SolarSuccess for NetSuite from Blu Banyan, work orders and service cases link straight to general ledger accounts, so costs are expensed or capitalized automatically based on company policy without a separate manual entry.[2] Each closed case also writes its costs back to the asset record. That record then feeds the site and finance rollups covered in the next section.
| Event Type | Monitoring Action | ERP Action | Resulting KPI |
|---|---|---|---|
| Inverter Fault | Detects 0W output for 15+ minutes | Auto-creates corrective work order; links to Asset ID | MTTR; Asset Availability % |
| Meter Discrepancy | Flags 5–10% variance vs. modeled yield | Opens meter investigation case; flags revenue accrual | Energy Yield (kWh); Lost Revenue per Incident |
| Offline Alert | Telemetry loss for 15 minutes | Creates service ticket; triggers remote gateway reset | System Availability; Data Integrity |
| High Temperature | Sensor exceeds 158°F | Immediate safety shutdown; alerts O&M manager | Safety Incident Rate; Asset Lifespan |
| Repeated Alarm | Multiple identical alarms in short window | Groups into one incident; escalates to service manager | Repeat Failure Rate; O&M Cost per Asset |
Escalation logic matters just as much as the first routing step. If a faulted central inverter is still unresolved after four business hours, bump the priority and notify a supervisor. A single workflow rule can remove a lot of manual follow-up across the portfolio.
Those workflow links set up the site rollups that follow.
How to Roll Up Asset Data into Site, Service, and Finance Views
With asset IDs, status history, and work orders already connected, ERP can roll that data up into site and portfolio views using the same asset records created earlier.
Use Site Rollups for Portfolio Performance and Maintenance Planning
Once work orders, service history, and costs flow back into asset records, ERP can turn them into site and portfolio views. A site rollup pulls from those records to show which sites need attention first. Use availability and performance-ratio benchmarks to flag sites that are producing below expected output.
Rollups also make spare parts planning much easier. ERP can count each inverter model across the portfolio, track failure trends, and flag minimum stock levels for regional warehouses before a breakdown turns into an emergency order. kWh Analytics reports that inverters cause 51% of corrective maintenance issues and account for 55% of O&M ticket duration and 59% of energy lost.[3] That’s why inverter availability should sit near the top of any site rollup dashboard.
In SolarSuccess, these rollups use NetSuite SuiteAnalytics and saved searches to surface real-time site metrics and link straight from a dashboard tile to the underlying asset or work order record.
Those operating rollups feed the cost, warranty, and depreciation view below.
Link Each Asset Record to Cost, Warranty, and Depreciation Data
Track acquisition cost through purchase orders and vendor bills. Post operating costs – labor, parts, travel, and site overhead – back to the asset. Allocate contract revenue by measured production.
Warranty data adds another layer of control. Each asset record should store warranty start and end dates, coverage type (parts-only vs. parts-and-labor), and performance guarantees. When a fault occurs, the ERP checks warranty status automatically and routes the case based on coverage – vendor RMA if the part is covered, standard work order if it isn’t. That check moves covered repairs to the vendor.
For U.S. tax and book reporting, depreciation schedules tie straight to the asset record: depreciable cost basis in USD, in-service date, useful life (typically 25 years for panels, 10–15 years for inverters), and method (straight-line, MACRS, or declining balance). SolarSuccess uses NetSuite’s fixed asset and project accounting modules to post depreciation entries automatically and tag them to the site and portfolio, keeping technical records and financial statements in sync.
The table below shows how the same underlying asset data appears differently depending on who’s looking at it:
| Level | Key Metrics | Typical Unit | Primary Users |
|---|---|---|---|
| Site | Total installed capacity, total energy produced, availability %, site revenue, open work orders | MW / kWh / USD | Site managers, operations teams |
| Portfolio | Aggregate capacity, total production, total revenue, O&M cost per kWh, performance ratio | MW / kWh / USD | Asset managers, finance leaders, executives |
With these three layers connected – asset records feeding site rollups, site rollups feeding portfolio dashboards, and all of it tied to GL accounts – finance teams can see revenue per kWh, O&M cost per kWh, and gross margin per kWh in one place, using USD and MM/DD/YYYY formats. That same structure carries into the implementation checklist.
Implementation Checklist and Next Steps
Configure Multi-Site Asset Tracking Step by Step
Once your asset records, workflows, and rollups are set, it’s time to put them into ERP in the right order. That order matters. If you skip ahead or load things out of sequence, you can end up with broken links between assets, sites, service records, and finance data.
Use this checklist to roll out multi-site asset tracking without damaging record integrity.
| Configuration Step | Responsible Role | Key ERP Modules |
|---|---|---|
| Define the master asset structure | Asset manager / ERP administrator | Asset management, fixed assets |
| Load site and project master records | Project manager / ERP administrator | Project management, CRM |
| Import inventory and as-built data | Data migration specialist | Asset management, procurement |
| Validate serials and nameplate capacities for inverters, meters, and panels | Engineering lead / commissioning manager | Asset management, quality control |
| Connect monitoring feeds | Integration developer / IT | Integrations, IoT or monitoring connector |
| Test alarm-to-work-order flows | Service manager | Field service, workflow automation |
| Set warranty, depreciation, and service contract links | Finance manager | Fixed assets, finance, service contracts |
Before go-live, run an exception report that flags missing serial numbers, mismatched capacities, and inverters or meters tied to the wrong site. This is one of those steps you don’t want to treat as a formality. A small mismatch here can turn into messy service tickets and bad cost tracking later.
It also helps to test one fault alarm from start to finish: case creation, status update, and cost capture. That full path tells you whether the system works under pressure. If that chain breaks in testing, it will break in production.
After workflow testing passes, lock down the integration layer. Send high-volume telemetry through middleware so system performance stays steady as the portfolio gets larger. For data in transit, use TLS 1.2 or higher. And give every IoT payload an idempotency key to stop duplicate records caused by network retries.[1] SolarSuccess runs on NetSuite, with monitoring integrations handled through SuiteTalk or RESTlet connections.
Key Points to Carry Forward
With the setup in place, the portfolio can run from one shared operational view across service and finance. That means each site, service case, and finance record points back to the same asset source of truth.
FAQs
How should I structure solar assets across multiple sites in ERP?
Use a clear three-level hierarchy: portfolio → site → device. That setup makes it easy to roll up performance and financials across regions, while still letting you drill down to individual inverters.
Give each asset a single, consistent ID that matches your monitoring system. At the time of creation, require the key fields. Also standardize location names, statuses, and location fields so updates flow to the right place across sites.
What monitoring data belongs in ERP versus the monitoring platform?
Monitoring platforms deal with high-frequency data like raw telemetry and live sensor streams. In most cases, that data should stay in the monitoring platform or in middleware, where routing, retries, and transformation are handled.
Your ERP, such as SolarSuccess, should hold processed data that teams can act on, like energy yield, downtime logs, and threshold-based alerts. That gives you the right data for records, reporting, and day-to-day workflows.
How do ERP alarm workflows connect to service costs and depreciation?
ERP alarm workflows connect live asset alerts to financial records. When a sensor sets off an alert, the ERP can automatically open a work order and post maintenance, labor, and parts costs to that exact asset instead of dumping them into general expense accounts.
That matters because each service event stays tied to the asset record. As a result, teams can track warranty recoveries, lifecycle cost, and even depreciation changes based on the asset’s condition and service history.
