
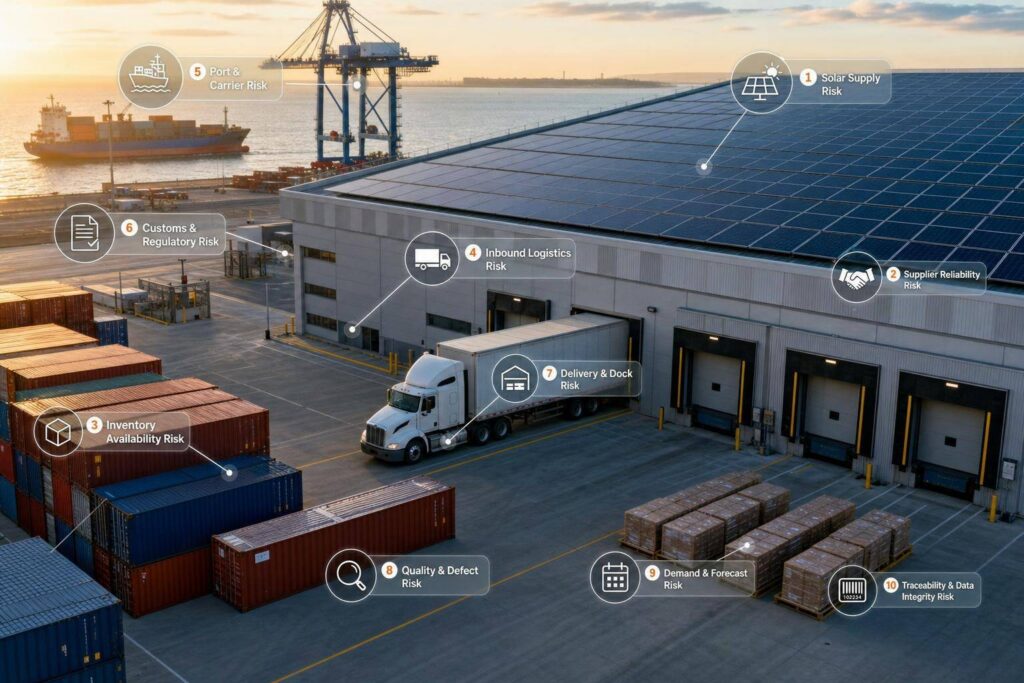
One customs hold, one tariff change, or one late supplier can push a solar project off schedule and cut margin fast. In the U.S., solar teams still depend heavily on imports from Southeast Asia, while upstream materials remain tied to China. That leaves procurement, logistics, finance, and compliance exposed to delays, duty shifts, detention risk, and price swings.
If I had to boil this article down to one point, it’s this: a solar ERP should track risk early, at the PO, shipment, supplier, inventory, and compliance-record level. The 10 items to watch are:
- Single-source dependency
- Customs holds and UFLPA detention
- Demand swings and forecast variance
- Freight cost spikes
- Factory shutdowns
- Sanctions, tariffs, and trade policy changes
- Supplier lead-time drift
- Solar material price volatility
- Inventory exposure and safety stock gaps
- ESG and human-rights traceability risk
A few numbers show why this matters:
- In Q1 2024, 87.5% of U.S. PV module imports came from Vietnam, Thailand, Malaysia, and Cambodia
- China still controls much of the upstream solar chain, including 72% of polysilicon capacity
- After UFLPA took effect in June 2022, solar shipments became a major target for detention review
- Freight, duties, and module pricing can shift landed cost by cents per watt, which can mean hundreds of thousands of dollars on one project
Quick Comparison
| Risk | What I’d track in ERP | What can go wrong |
|---|---|---|
| Single-source dependency | Supplier count per critical SKU | One supplier issue stalls many jobs |
| UFLPA/customs holds | Detention status, origin docs, chain of custody | Port delays, storage costs, missed milestones |
| Forecast variance | Forecast vs. demand by week/month/quarter | Overstock or shortages |
| Freight spikes | Quoted vs. actual freight, ETA changes | Margin loss and late delivery |
| Factory shutdowns | Supplier production status, PO impact | Output delays and schedule slips |
| Tariffs and sanctions | HS codes, duty rates, effective dates | Landed cost jumps, blocked sourcing |
| Lead-time drift | Promised date vs. receipt date | Slow supplier decline that hurts planning |
| Price volatility | Unit-cost variance by item/project | Budget overruns before POs are placed |
| Inventory gaps | On-hand vs. safety stock | Rush buys, idle crews, project delay |
| ESG/human-rights risk | Missing traceability and audit records | Shipment holds, financing or bid issues |
Put simply: if your accounting and finance software can’t connect supplier data, shipment data, landed cost, inventory, and traceability records, you’ll spot many of these problems too late. This article explains the main signals to monitor and the dashboard metrics I’d keep in view.
U.S. Solar Supply Chain Vulnerabilities at a Glance
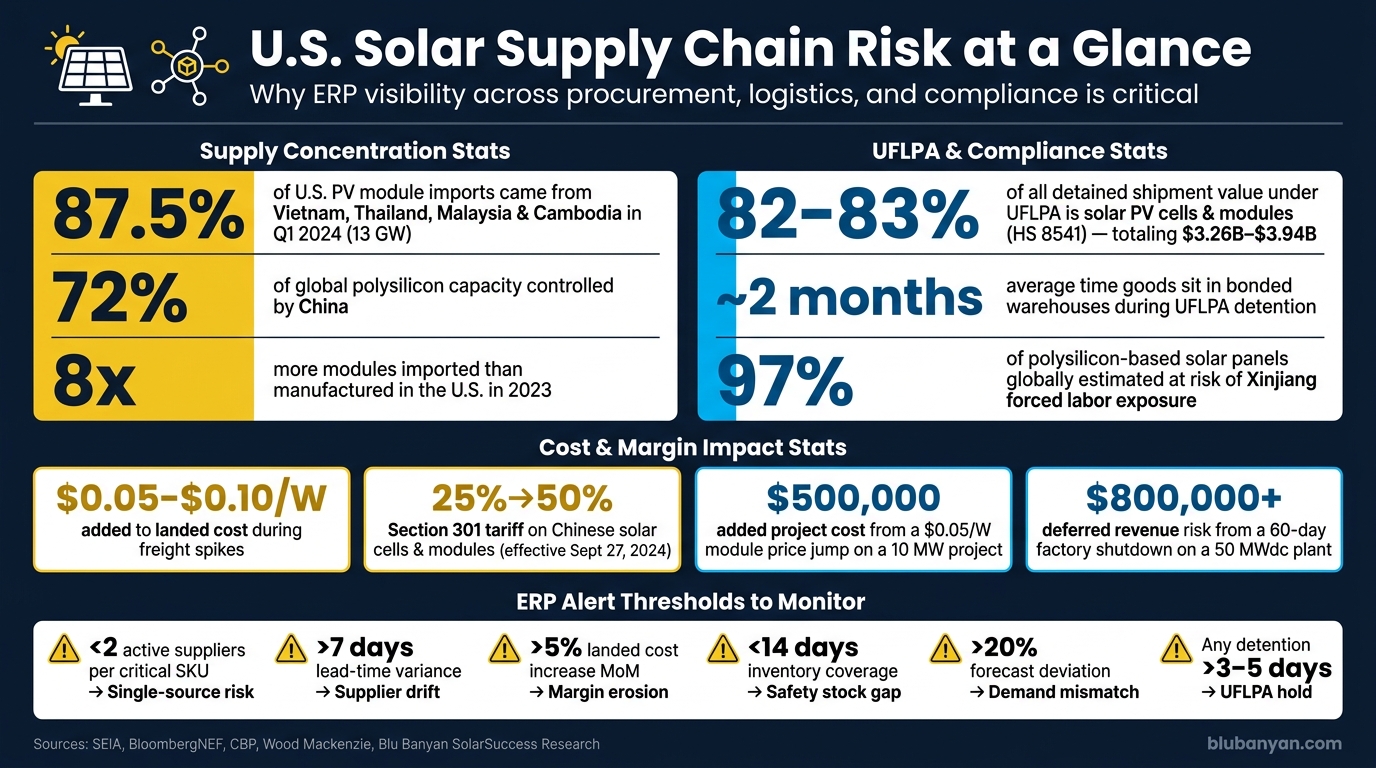
The U.S. solar supply chain may look spread out on the surface, but the weak spots are still pretty concentrated. In Q1 2024, factories in Vietnam, Thailand, Malaysia, and Cambodia supplied 13 GW, or 87.5%, of U.S. PV module imports. And the deeper you go into the supply chain, the more concentrated it gets. China controls an estimated 72% of global polysilicon capacity, 98% of ingots, 97% of wafers, 81% of cells, and 77% of modules. That means a module assembled in Southeast Asia can still depend heavily on China for the parts and materials upstream.
U.S. solar manufacturing has grown, but most “domestic” production is still module assembly built on imported cells and components.[10] In 2023, the U.S. imported roughly eight times the modules it manufactured, with nearly 80% coming from Southeast Asia. The Solar Energy Industries Association‘s manufacturing roadmap aims for 50 GW of domestic capacity across key segments by 2030, yet U.S. capacity for ingots, wafers, and cells remains effectively zero.[5] So the gap isn’t just about volume. It’s also about which steps of production happen inside the country and which still depend on foreign supply.
Then there’s the compliance side. UFLPA gives CBP the power to detain shipments and require importers to prove, through documentation, that no forced labor was involved.[6] If an ERP system and supplier files can’t show lot-level traceability, containers can sit at port for weeks. That turns a sourcing issue into a scheduling and cash-flow problem fast.
Trade actions add another layer of risk. Section 201 safeguards, Section 301 tariffs, AD/CVD actions, and sanctions can change landed cost and product availability almost overnight. One policy shift can ripple through purchasing plans, customs entries, vendor choices, and project budgets. Streamlining operations through these shifts is critical for maintaining project timelines.
The table below shows the main vulnerability categories and the ERP signals they affect:
| Vulnerability | ERP Signal | What to Track |
|---|---|---|
| Manufacturing concentration | China controls upstream inputs; Southeast Asia dominates assembly | Correlated risk across multiple supply tiers |
| Import reliance | U.S. imports roughly eight times more modules than it manufactures | Exposure to freight, customs, and trade policy changes |
| UFLPA enforcement | Rebuttable presumption of forced labor for Xinjiang-linked goods | Shipment detention, documentation burden, project delays |
| Section 201 / 301 tariffs | Trade dispute remedies on solar imports | Higher landed cost, sourcing shifts |
| AD/CVD actions | Unfair pricing or subsidy findings on imported panels | Sudden duty increases that alter import economics |
| Sanctions changes | Restrictions on specific entities, regions, or countries | Supplier substitution risk mid-project |
These issues tend to show up first in procurement, logistics, and compliance data. In practice, that means the earliest warning signs often sit inside the ERP long before a project team feels the delay on site.
What a Solar ERP Should Monitor Across Procurement, Logistics, and Compliance
Most supply chain issues show up in the data long before they hit the job site. The problem is that this data often lives in spreadsheets, inboxes, and systems that don’t talk to each other. That’s why the ERP layer matters so much across procurement, logistics, and compliance.
A solar ERP closes that gap by bringing purchasing, inventory, project schedules, supplier records, landed cost, and compliance documentation into one connected system. When those records update in real time, a delayed purchase order (PO), a freight cost jump, or an expiring ESG audit can show up as a risk flag before it hurts schedule or margin.
CBP now expects shipment-level traceability across every step of production. Without centralized records tied to each shipment, supplier, and PO, responses turn manual fast, and detention costs can climb in a hurry. That shared data base is what the ten risk signals below rely on.
A solar ERP should connect procurement, inventory, project, logistics, and compliance data in one view so risk signals are easy to spot before they disrupt delivery.
The ten risks below depend on that connected data base. It brings lead-time drift, customs holds, freight variance, and inventory gaps into view before they turn into delays.
1. Single-Source Component Dependency
The first risk comes up when a key part has no backup supplier. If a solar project depends on one vendor for a must-have component – modules, inverters, or racking hardware – a single disruption can slow or stop several projects at the same time.
That kind of tight supply base creates a weak spot. A customs hold, UFLPA detention, or factory outage can stall every project linked to that vendor.
The cost can pile up fast. Late delivery may lead to premium freight, push back COD, and eat into margin through liquidated damages.
The ERP should turn this dependency into a measurable exposure score. Any critical item with more than 30% single-source exposure should be marked high risk. It should also map item-supplier links, estimate replacement cost, and factor in expedited freight plus delay penalties when scoring that exposure.
Just as important, keep lot or batch traceability, country-of-origin data, and shipment documents tied to each PO. That way, teams can answer UFLPA or quality questions without digging through old emails. It also makes the next round of risk checks easier across customs, lead times, and compliance.
2. Customs Holds and UFLPA Detention Risk
A single-source part can turn into a customs problem fast when origin records don’t hold up under UFLPA review. The Uyghur Forced Labor Prevention Act (UFLPA) shifts the burden to the importer: if goods are linked to China’s Xinjiang region, they are presumed to be made with forced labor and blocked from entry unless the importer can prove otherwise.
Solar imports sit right in the blast zone. Xinjiang produces about 45% of global solar-grade polysilicon, and BloombergNEF has estimated that at least 95% of silicon-based solar modules likely contain some Xinjiang-origin silicon.
Since UFLPA took effect in June 2022, solar PV cells and modules under HS code 8541 have made up about 82% to 83% of all detained shipment value, totaling roughly $3.26 billion to $3.94 billion. And assembly in another country doesn’t make the issue go away. CBP has detained Maxeon modules imported from Mexico because of questions about upstream polysilicon provenance. In plain English: port screening can become a direct schedule hit.
A country-level review of UFLPA detentions from July 2022 through February 2024 found that:
- 51% of shipments were eventually released
- 27% were denied
- 22% remained pending, with goods sitting in bonded warehouses for about two months on average
That average matters. A two-month hold should be built into both project schedules and financing models. When inventory gets stuck, costs pile up fast: demurrage, storage, replacement purchases, and delay-related losses.
Because detentions begin with shipment data, the ERP needs to connect each PO to origin records, chain-of-custody files, and audit documentation. That means keeping multi-tier bill-of-materials data – from quartzite to polysilicon, wafers, cells, and module assembly – alongside supplier declarations and audit reports.
When a hold happens, the ERP should be able to produce a full traceability packet in hours, not weeks. It also needs to show which projects depend on the detained materials and run 30-, 60-, and 90-day detention scenarios. That includes recalculating revenue recognition dates, tax credit timing, and liquidated damages exposure in USD for each affected project.
3. Demand Swings and Forecast Variance
Supply risk is only half the story. Even if shipments arrive on time, bad forecasts can still throw schedules off. And in solar, demand swings create the same kind of disruption as late supply. The catch is that they often show up later, after purchasing plans are already in motion. When the forecast is off, procurement usually gets stuck with one of two problems: too much inventory or not enough.
The data shows just how uneven U.S. solar demand has become. In Q1 2025, residential installations fell 13% year over year to 1,106 MWdc, while utility-scale dropped 7% year over year to 9 GWdc – and 43% quarter over quarter. Those aren’t small moves. They hit demand for modules, inverters, racking, and batteries almost immediately, and that ripple goes straight into procurement plans.
Forecast error also eats into profit and pushes purchase volumes away from target. In solar, that hurts fast because procurement, delivery, and field work are tightly connected. One missing part can hold up the whole install. If that part sits on the critical path, a single missing inverter, module, or connector can delay a project by 10 to 14 days.
That’s why solar forecasting needs to be project-aware, not just sales-aware. Teams should pull CRM pipeline data, signed orders, project milestones, supplier lead times, and inventory availability into one view. Then forecast changes can turn into clear purchasing actions instead of last-minute scrambling. The ERP should also track variance by week, month, and quarter. Short-term misses usually do more damage to procurement than long-range forecast noise.
Forecast version history helps teams move from blame to action. By tracking forecast versions, order changes, supplier confirmations, and PO revisions, teams can see what changed, when it changed, and where the plan started to drift.
4. Freight Cost Spikes
Even when your forecast is solid, one thing can still throw the job off: logistics cost.
Freight prices don’t stay fixed after a project is quoted. When ocean rates jump – as they did during the COVID-era surge, when peak container pricing reached about $15,000 per 40-foot container – that extra cost hits the project directly, not the carrier. In a severe spike, container freight alone can add $0.05 to $0.10 per watt to landed cost and push total module costs up by 5% to 15%.
On a fixed-price job, that’s brutal. Margin can disappear even if equipment pricing hasn’t changed at all. And because the contract price is locked, the hit shows up fast. Your ERP needs to spot that change before it lands in job cost.
Freight spikes don’t just hurt margin. They can also throw off the schedule. Red Sea rerouting around the Cape of Good Hope added 10 to 14 days of transit time on affected lanes and pushed spot rates close to COVID-19 highs by mid-2024. In solar, those extra days can push commissioning past contract deadlines and set off liquidated damages clauses.
That’s why a solar business management software should track the gap between quoted freight and actual freight by shipment, lane, supplier, and carrier – not just total logistics spend. To do that, the system should store linked records for:
- purchase order
- bill of lading
- freight invoice
- container ID
- Incoterms
- fuel surcharges
- revised ETA
With that setup, finance and procurement can trace where the cost jump came from instead of hunting through email threads and PDFs. And when freight data connects to project milestones like “materials on site” and “construction start,” the ERP can estimate delay risk in days and flag the jobs with the most exposure before crews are already booked.
It also helps to set alerts for sharp moves in ocean rates, drayage, or demurrage. Then procurement and finance can act early. Freight invoices, PO terms, and project milestones should also feed landed cost updates into COGS and margin in real time.
Freight spikes often stack on top of the next risk: factory shutdowns and production interruptions.
5. Factory Shutdowns and Production Interruptions
Factory shutdowns don’t just slow shipping. They stop output at the source. That’s why factory uptime is its own risk signal, separate from freight delay.
When a key manufacturer in China or Southeast Asia goes offline, module and component deliveries can slip by weeks or even months. During COVID-19, shutdowns across Asian manufacturing regions led to a 3.5–4 GW shortage of solar module production, which then pushed back U.S. utility-scale projects on a broad scale. Even shorter disruptions can throw project plans off balance. Crews may need to be resequenced, EPC schedules may need to be renegotiated, and milestones can slide.
The cost impact adds up fast. If a shutdown forces procurement to switch suppliers at an extra $0.03/W and expedited freight adds $0.01/W, those charges hit both the PO and the project budget. Add $5,000/day in liquidated damages, and a 60-day delay on a 50 MWdc plant can lead to about $800,000 in deferred revenue plus $300,000 in penalties.
Once output starts to slow, the ERP should shift from detection to response. Shutdowns may be unplanned, or they may come from scheduled maintenance, so a solar ERP should track factory status, update lead times, and flag every open PO tied to that supplier. It should also log delay variance across each stage, including manufacturing lead time, shipment departure, in-transit time, and site delivery, then roll those inputs into a single project delay estimate.
That record should connect each shutdown to the affected POs, shipments, components, suppliers, and project tasks, so finance, procurement, and construction all work from the same source. Blu Banyan‘s SolarSuccess can connect shutdown alerts to open POs, project milestones, financials, and team communication.
6. Sanctions, Tariffs, and Trade Policy Changes
When shutdowns hit supply, you get a volume problem. When trade policy shifts, you get a cost and eligibility problem. And that can change fast. Trade rules can alter landed cost or even block import eligibility overnight. Since 2011, the number of duties and import taxes across the solar PV supply chain has climbed from 1 to 16, with 8 more under consideration.
Duty stacking is where things get painful. Section 301 tariffs on Chinese solar cells and modules jumped from 25% to 50% on September 27, 2024. On top of that, Section 201 safeguard tariffs add 14.25% for entries from February 7, 2024, through February 6, 2025, and 14.00% for entries from February 7, 2025, through February 6, 2026.
Put those layers together with AD/CVD duties, and the math changes in a hurry. A $0.10/W module can end up at a landed cost of $0.191–$0.38/W. That kind of jump can turn a healthy project into a money-loser.
There’s also an availability risk that doesn’t show up on a simple pricing sheet. If origin can’t be proven, shipments can be detained or excluded. That can happen even when the finished module comes from a third country. For importers, granular origin traceability isn’t nice to have. It’s the difference between goods moving and goods getting stuck at customs. The ERP should flag these changes before the shipment clears customs.
A solar ERP should keep key trade data at both the item and supplier level, including:
- HS codes
- Country of origin
- Duty rates
- Effective dates
From there, the system should recalculate duty-driven landed cost, open PO cost, budget, and margin in real time when a rate changes or a supplier gets flagged. Blu Banyan’s SolarSuccess handles this with native landed cost and tax engines, plus custom fields that allocate duty components across inventory receipts and project cost codes.
Procurement teams also need backup on the document side. Supplier declarations, certificates of origin, and audit findings should be tied straight to POs, item receipts, and inventory lots. bluDocs keeps clearance documentation attached to the PO and lot, which makes review far less messy when questions come up.
Policy changes often show up first in day-to-day operations as longer lead times and delayed arrivals.
7. Supplier Lead-Time Drift
After shutdowns and policy shocks, the next red flag is slower and much easier to miss: supplier lead-time drift.
This kind of drift sneaks up on you. A supplier that used to deliver modules in 30 days starts landing at 38, then 45. One late PO might not set off alarms. But when you track the gap between the promised date and the actual receipt date across repeat POs, a pattern starts to show. That widening gap is the early signal. And by the time it’s obvious, crews are already on the calendar and the delay is costing money.
The hit to the project is direct. A 7-day slip in module arrival can turn into a 10–14-day delay in overall project completion once crew moves, inspection rescheduling, and site coordination are added to the mix. Critical electrical equipment can also stretch from 16 months to more than 2 years.
That drift creates pressure fast. Teams start paying for expediting. Labor sits idle. And if energization slips, customer concessions or contract penalties can turn a slow-moving issue into a margin problem.
Your ERP should track three fields on every PO line:
- Promised delivery date
- Actual receipt date
- Difference in days
From there, roll the data up by supplier, item, and freight mode. That gives you a clean view of where delays are building.
Once lead-time variability moves above 25% lead-time variability, safety stock needs climb fast. Above 50%, that supplier becomes tough to plan around. SolarSuccess by Blu Banyan tracks this at the item-supplier level with scorecards and exception dashboards. Persistent drift also pushes up expedite spend and inventory pressure, which then feeds price volatility.
8. Solar Material Price Volatility
Lead-time drift is a slow burn. Material price volatility is the opposite. It can slam a project estimate in a matter of days, sometimes before a purchase order is even sent.
For U.S. solar projects, the inputs that tend to move the most are modules, polysilicon, inverters, aluminum racking, and copper balance-of-system parts. U.S. module prices climbed about 14% between January and November 2025, hitting a median of $0.28/W by Q1 2026. That’s a big spread versus global spot prices, which were below $0.09/W in early 2026. The gap was driven by higher U.S. input costs. Silver is also adding pressure, now making up about 16% to 17% of total module cost.
The margin math changes fast. Picture a 10 MW commercial project budgeted at $0.90/W with modules priced at $0.30/W. A $0.05/W jump adds $500,000 to total project cost. If you can’t pass that increase to the customer, it comes straight out of gross margin.
Price swings also create schedule delay risk, and that part is easy to miss. When prices spike, procurement teams may hold off on issuing POs while they check other vendors or wait to see where the market lands. That pause can push material delivery back by 10 to 30 days on commercial projects. Then the ripple effect starts: float gets eaten up on critical-path tasks, crews wait, and deadlines get tighter. If a PPA start date or an incentive qualification window is on the line, those lost days can turn into direct dollar hits. The delays can also push purchases into the next inventory cycle.
The ERP signal to watch is unit-cost variance by item and project. Track dated cost history for each material, including:
- standard cost
- last purchase price
- contract price
- spot price in USD
Then tie that data to the bill of materials and project estimates so margin updates happen on their own. SolarSuccess by Blu Banyan links item costs to opportunities and projects in NetSuite, so margin updates happen in real time.
9. Inventory Exposure and Safety Stock Gaps
When lead times slip and prices change, inventory is usually the next place things break. Inventory exposure is the dollar amount at risk when open orders, pricing, and lead times no longer line up with project demand. And when key parts fall short, project management excellence becomes critical as the fallout hits fast: emergency buys, premium freight, and crews standing around with nothing to install.
Here’s what that can look like in practice. A 10 MW commercial project with a budgeted inverter cost of $0.08/W ($800,000 total) that suddenly needs a rush purchase at $0.095/W, plus expedited freight, adds $150,000 in direct cost overruns. On utility-scale projects, the same kind of exposure can drive overruns into the $50,000 to $500,000 range, depending on contract terms and how long the delay lasts.
The schedule hit is just as painful. If combiner boxes or racking parts are missing, commercial rooftop milestones can slide by two to four weeks. On utility-scale work, shortages in trackers or medium-voltage gear can delay completion by 30 to 90 days when lead times stretch past a month and grid interconnection windows are missed.
That’s why safety stock can’t be treated like a warehouse-side detail. It needs to be tracked by item class and project phase, including:
- standard components
- long-lead equipment
- project phase
In practice, the ERP signal to watch is on-hand inventory versus safety stock thresholds, by item and by project. SolarSuccess can track material availability against milestones and show which items are below safety stock, how many days remain, and which phases are at risk.
10. ESG and Human Rights Compliance Risk
Not all supply risk is physical. You can have inventory ready to go and still watch a shipment stall if traceability is missing.
Under the Uyghur Forced Labor Prevention Act (UFLPA), goods mined, produced, or manufactured wholly or in part in Xinjiang are presumed to be made with forced labor unless the importer can rebut that presumption. CBP treats solar panels and polysilicon as high-risk enforcement items. The same origin data used for customs clearance also supports ESG due diligence.
The scale of enforcement makes this hard to brush aside. Research suggests that 97% of all polysilicon-based solar panels globally are at risk of exposure to Uyghur forced labor. And the root issue often starts well before a shipment reaches customs. If a manufacturer will not share sub-tier sourcing details, traceability falls apart upstream. That missing link is often what leads to detentions and requests for more documents.
This risk does not stop at the border. When traceability is weak or missing, the fallout can include bid rejection, financing denial, or contract termination. On top of that, the reputational hit tied to a forced-labor association can be hard to shake.
A solar ERP should connect each part number or SKU to its country of origin, manufacturing site, and supplier tier and sub-tier. It should also keep the records needed to prove that trail, including:
- certificates of origin
- audit reports
- corrective action records
- chain-of-custody files
It should also flag warning signs early, such as missing supplier records, unexplained use of brokers or trading intermediaries, inconsistent origin data, and suppliers that refuse to disclose sub-tier sources.
Blu Banyan’s SolarSuccess supports centralized storage of supplier records, origin documentation, and compliance workflows. That gives procurement and compliance teams one place to respond to CBP inquiries or customer due diligence requests, instead of scrambling through emails and shared drives. Any supplier or shipment with incomplete traceability should be flagged before the PO is issued, and those exceptions should flow into the dashboard views below.
Key Metrics and Dashboard Views for Supply Chain Risk Monitoring
These risks matter most when you can see them in one place, not scattered across different systems. A solar ERP should pull them into role-based dashboards for procurement, logistics, compliance, and finance.
The table below translates those risks into ERP metrics you can track, alert thresholds, and the records each metric should pull from.
| Metric | Why It Matters | Alert Trigger | Source Record |
|---|---|---|---|
| Supplier Count per Critical SKU | Flags single-source dependency on critical SKUs | < 2 active, approved suppliers | Vendor Master / Item Record |
| Planned vs. Actual Lead Time (days) | Detects lead-time drift | > 7 days or > 10% | PO History / Goods Receipt |
| Landed Cost per Watt (USD) | Tracks freight, duty, and material cost pressure | > 5% increase month-over-month | AP Invoices / Landed Cost Module |
| Demand Forecast Variance (%) | Prevents excess inventory or project-stopping shortages | > 20%–25% deviation from monthly plan | Demand Planning / Project Schedule |
| Shipment Detention Status | Surfaces UFLPA holds and customs delays | Any “Hold” or “Detained” status > 3–5 business days | TMS / Customs Documentation |
| Tariff Effective Dates | Alerts procurement to upcoming rate changes | < 30–60 days until rate change | Trade Compliance / Tariff Master |
| Inventory Coverage (days on hand) | Confirms safety stock against current project burn rate | < 14 days for critical components | WMS / Inventory Management |
| Supplier Country-of-Origin Mapping | Monitors concentration in high-risk regions for UFLPA and ESG exposure | > 20% of planned volume from high-risk origin | Item Master / Traceability Records |
| Factory Uptime / Shutdown Status | Flags active or anticipated production interruptions at key suppliers | Any confirmed or reported shutdown affecting open POs | PO History / Supplier Records |
| ESG / Human Rights Compliance Status | Tracks missing traceability, audit gaps, or sub-tier sourcing flags | Any supplier or SKU with incomplete origin or audit documentation | Compliance Records / Traceability Files |
A few of these metrics deserve extra attention.
- Landed cost per watt should be tracked by supplier and by month. That makes it easier to spot margin erosion early, before it shows up in project financials.
- Forecast accuracy can help teams catch project timing shifts before they turn into inventory shortfalls or excess stock sitting in the warehouse.
Blu Banyan’s SolarSuccess can surface these metrics in procurement and project finance dashboards.
Conclusion
The 10 risks in this article show up again and again across procurement, logistics, and compliance. A solar ERP helps turn those supply chain risks into clear ERP metrics. When procurement, logistics, inventory, and compliance data sit in one system, planners and buyers can spot exceptions early and step in before small issues become bigger ones. That’s why the dashboard metrics above matter.
The key is bringing supplier diversification, compliance documentation, cost visibility, and threshold-based alerts into one workflow. When you look at those signals together, risk stops being vague. It becomes something a solar ERP can track and act on.
Blu Banyan’s SolarSuccess brings supply chain data into one place, automates alerts, and gives procurement and operations teams a shared view of risk.
With continuous monitoring, solar teams are better positioned to protect delivery dates, control costs, and preserve margin.
FAQs
Which supply chain risks should a solar ERP prioritize first?
A solar ERP should focus first on the risks most likely to delay projects and drive up costs, especially single-source suppliers for critical parts.
Start with real-time visibility into inventory shortages, lead-time drift, shipment delays, vendor performance, and compliance status. That way, teams can spot problems early and deal with them before they snowball.
What data is needed to track UFLPA and customs risk?
Your ERP should keep tariff data and forced-labor traceability documents in one place.
That usually means storing key records like:
- Unredacted master supply agreements
- Manufacturer production logs that trace materials from raw sourcing through finished modules
- Xinjiang-free sourcing affidavits
When this data sits alongside project demand and logistics events, your team can act before problems snowball. It helps prevent stranded freight and cuts the risk of penalties, storage costs, and lost sales.
How can ERP alerts help protect project margin?
ERP alerts help protect project margin by flagging supply chain and vendor problems early. That includes delayed shipments, price spikes, compliance changes, and inventory or order mismatches before they turn into schedule slips or cost overruns.
That gives teams time to act fast, shift ordering or resource allocation, tighten job costing and milestone-based invoicing, and avoid too much inventory or painful shortages that can throw a project off budget and off schedule.
